
User Manual
FrontierStack
Desktop Edition
Install, run and monitor Apache, databases, mail, security and 1,000+ services on your Mac and across your fleet — with an AI administrator at the helm.
Table of Contents
- 8Connecting Servers: Locations & the Fleet
- 9Networking & the Perimeter
- 10Security & Hardening
- 11Monitoring & Alerts
- 12Scripts, Cron & Automation
- 13The AI Administrator
- 14FrontierStack in Agentic Workflows
- 15The AI Stack
Part I
What FrontierStack is, how it thinks, and how to get it running on your Mac.
Chapter 1
Introduction
The server control panel Apple took away — rebuilt for one Mac or a whole fleet, and driven by an AI that can actually see and fix your servers.
When Apple discontinued macOS Server.app, Mac users lost the simple, point-and-click way to run websites and services. FrontierStack brings that back and goes much further: it installs, controls, secures and monitors Apache, PHP, MySQL, PostgreSQL, Nginx and more than a thousand other services — on the Mac in front of you and on every server you link to it — and it puts a tool-using AI administrator at the helm.
This manual is the complete reference for the desktop app. A companion Mobile Manual covers the iPhone and iPad app. Read this first chapter end to end; after that, dip into whichever part you need.
1.1What FrontierStack is
FrontierStack is a native macOS application — not a web panel, not a container you have to babysit. It manages real services on real machines using the tools they already ship with: Homebrew formulae, launchd and systemd units, Apache and Nginx config, certificates, firewalls and SSH. It is three things at once:
- A control panel. Install, start, stop and configure services with validation, live status and one-click fixes — the macOS Server replacement, modernised.
- A monitoring and alerting system. A continuous health sweep watches services, sites, certificates, disks and your whole fleet, and turns the first sign of trouble into a message on the channels you choose.
- An AI administrator. A guard-railed, tool-using assistant with a live, accurate picture of your setup. It can diagnose what is broken, propose a fix you approve, run it locally or across your fleet, and reshape the app to exactly what you run.
1.2An AI-first design
Most apps bolt a chat box onto the side. FrontierStack is built the other way around: the AI is a first-class operator of the same controls you use. Because it acts only through a fixed set of audited tools — read a log, run a diagnostic, restart a service, issue a certificate, write a file — everything it does is something you could do by hand, and everything that changes the system is shown to you for approval first.
Three principles make this safe enough to trust with production servers:
- Read-only by default. Out of the box the assistant can look but not touch. Changes and scripts are unlocked by explicit toggles, and every mutating action shows an approval card before it runs.
- Your secrets never reach the model. Passwords and API tokens live in a local
.envvault. Scripts reference them by name; the app injects the real value at run time, locally or over SSH. The cloud model sees the name, never the value. Logs and files are secret-redacted before they are sent. - You bring your own AI. Point it at a cloud model or a local one (Ollama, LM Studio). If you drive it from your own subscription tool over MCP — Claude Code, Cursor — there is no metered per-token bill at all.
1.3Who it is for
FrontierStack suits anyone running — or wanting to run — servers on a Mac:
- Developers who want a clean local stack instead of MAMP or XAMPP.
- Small businesses self-hosting POS, CRM, e-commerce, mail and helpdesk on a Mac mini.
- Admins keeping a vintage Xserve or Mac mini on macOS Server useful by managing it remotely.
- Anyone moving from metered SaaS to self-hosted, or running a fleet of Macs, Linux boxes, BSD servers and Raspberry Pis from one window.
1.4Key concepts and vocabulary
A handful of terms recur throughout this manual. Meet them once here.
| Term | What it means |
|---|---|
| Service | Anything FrontierStack can install, run and monitor — Apache, a database, a mail server, a container, a router integration. The full list is the catalog (Chapter 6). |
| Pane | A screen in the app for one service or tool, opened from the sidebar. |
| The helper | A small privileged tool (an SMAppService daemon) that performs admin actions without a password prompt each time. Optional; you install it on first run. |
| Location | Where the Mac is on the network right now (home, office, away). Locations make alerts and reachability network-aware (Chapter 8). |
| Linked server | Another machine you have connected over SSH so FrontierStack can run diagnostics and scripts on it. Your fleet is all of them together. |
| The AI Administrator | The built-in tool-using assistant. Also called the AI Harness. Covered in depth in Chapter 13. |
| MCP | Model Context Protocol — the open interface that lets an outside AI tool (Claude Code, Cursor) drive FrontierStack through the same guarded tools (Chapter 14). |
| Secret / the vault | A named credential in the local .env store. Scripts reference $NAME; values stay on your Mac. |
1.5How this manual is organised
The manual follows the shape of the work:
- Part I — Getting Started: install, first run, and a tour of the interface.
- Part II — Running Services: the web stack, databases, the full catalog, and sites & domains.
- Part III — Fleet, Network & Security: linking servers, networking and the perimeter, hardening, and monitoring & alerts.
- Part IV — Automation & AI: scripts and schedules, the AI Administrator in full, MCP, and the AI stack.
- Part V — Business & Reference: vertical solutions, settings, shortcuts, licensing and troubleshooting.
If you are brand new, continue to Chapter 2, Installation & First Run. If you just want to understand the AI, jump ahead to Chapter 13 — but the safety model there assumes the concepts above.
Chapter 2
Installation & First Run
From a fresh download to a working stack: what macOS asks for, the optional helper that makes admin painless, and how to bring an existing MAMP, XAMPP or Server.app setup across.
FrontierStack installs like any other Mac app — drag it to /Applications and open it. What happens next is up to you: it can run entirely with the per-action password prompts macOS already gives you, or you can grant it a small set of permissions once and never be asked again. This chapter walks the whole first run, then shows how to migrate an existing local stack so you keep your sites and databases.
2.1System requirements
FrontierStack is a native, signed macOS application. You need:
| Requirement | Detail |
|---|---|
| macOS | macOS 13 (Ventura) or later. The optional helper uses SMAppService, which is a macOS 13+ API. |
| Architecture | Apple silicon or Intel. The app manages the Homebrew stack at /opt/homebrew on Apple silicon (or /usr/local on Intel). |
| Homebrew | Recommended but not required to launch. Most services are installed as Homebrew formulae; FrontierStack can install Homebrew for you (see below). |
| Admin account | An administrator account on the Mac. Installing services and editing system config needs admin rights — either through the optional helper, or via the password prompt macOS shows per action. |
Nothing in this list is unusual; if your Mac is recent enough to run a current macOS, it can run FrontierStack.
2.2Downloading and first launch
Download the app, move FrontierStack.app into your /Applications folder, and double-click it. Because the app is signed by Enfour, Inc. (Apple Developer team 6Y87KNMALP) and notarised, macOS opens it without the unidentified-developer warning.
- Open FrontierStack. The main window appears with the service sidebar on the left and a health overview in the centre — the layout you met in Chapter 1.
- If Homebrew isn't present yet, panes that need it will say so and offer to install it. You can do that now or later.
- FrontierStack enforces a single running instance. If a copy is already open and you launch it again, the existing window is simply brought to the front rather than a second copy starting. This keeps two windows from fighting over the same services and config files.
The first launch makes no changes to your system. The app reads what is installed and shows you the state of things; nothing is started, stopped or reconfigured until you ask.
2.3The Setup Assistant
The first time you open FrontierStack it offers a short Setup Assistant rather than dropping you into a sidebar of several hundred services. It is seven pages, it asks about you rather than about configuration, and nothing it asks is permanent — every answer only decides what the app shows and suggests first. You can leave at any point and reopen it from Add Server or Device ▸ Setup Assistant.
| Page | What it asks |
|---|---|
| Goals | Run a business, build and develop, manage servers, manage clients, self-host services, or look after a home network. More than one is fine. An existing MAMP-style setup found on the Mac pre-selects the migration path. |
| Environment | Your experience with server administration, how many people the setup serves, and how many devices you look after — one Mac through to more than 250. |
| Stack | Apache, Nginx, PHP, Node.js, Python, MySQL, PostgreSQL, MongoDB, Redis, Git and the rest, with an offer to install what is missing. |
| AI | Whether the AI Administrator should use AI subscriptions you already pay for, or an API key or local model. |
| Review | What will be installed and what is only suggested, shown before anything runs. |
| Backups | Whether to keep an hourly, versioned settings history on this Mac (on by default) and, optionally, a daily copy in a folder that syncs elsewhere such as iCloud Drive or Dropbox — so pins, Setups, Locations, preferences and Apache/PHP configuration survive an OS upgrade or a reset. |
| Licence | Where you stand: an active licence, or what is available without one. |
The last page is about licensing, and it is honest rather than a sales gate. FrontierStack works unlicensed — monitor this Mac, connect servers, use the AI Administrator, read every diagnostic. One capability in the plan you just built is licensed: running a migration. Moving a stack copies databases, sites and configuration onto a target and changes what runs there, so it needs a licence. Without one FrontierStack still detects the source, lists the sites and databases it found, and shows exactly what a migration would move — and the AI Administrator will still write you the full plan. Only carrying the move out is gated, and the Migration pane says so on the button rather than failing silently.
Containers, backup destinations and monitoring are deliberately not installed from the Stack page. They need decisions the assistant should not make on your behalf, so they go into the plan instead.
2.4The privileged helper — and the permissions macOS asks for
Starting and stopping services and editing system configuration (Apache, Nginx, MySQL, DNS, the firewall) are privileged operations. Out of the box, FrontierStack performs each one through the standard macOS authorisation prompt: you type your password every time. That is safe but quickly becomes tedious.
The optional helper removes that friction. It is a small privileged tool — an SMAppService daemon — that the app registers with macOS so it can carry out admin actions without re-entering your password each time. You install it deliberately: use the Install affordance at the foot of the sidebar, or accept the prompt when an action first needs it.
- Click Install on the helper row at the bottom of the sidebar.
- macOS shows its Login Items & Extensions approval (or asks you to enable the background item in System Settings ▸ General ▸ Login Items). Approve it — this is macOS asking whether to let the daemon run, not the app overriding anything.
- The sidebar row flips to show the helper registered and running. From now on, service start/stop and config edits proceed without the per-action password prompt.
You can remove the helper at any time; FrontierStack then falls back to per-action admin prompts. Both modes work — the helper is purely a convenience.
6Y87KNMALP) as the app, which is what lets it register as an SMAppService daemon at all. It runs only the privileged operations the app drives; it is optional, you install it deliberately, and you can remove it. Like the AI Administrator and every remote action, it is off until you turn it on. For the full trust model see Chapter 10.2.5Installing Homebrew
Most of the catalog — web servers, databases, caches, mail, dozens of CLI tools — is installed as Homebrew formulae. Homebrew is the package manager FrontierStack uses to fetch and update those services, so if it isn't already on your Mac you'll want it early.
Open the Homebrew pane from the sidebar. If Homebrew is missing, the pane says "Homebrew isn't installed. It's the package manager this app uses to install services," with a Get Homebrew… button. Installation runs in the app's in-app console: it executes the official Homebrew installer and, at the point the installer needs administrator rights, you type your own password into the console. FrontierStack never captures or stores it — the prompt is Homebrew's own.
Once Homebrew is present, the pane becomes a full package manager: a searchable table of installed formulae and casks with their versions, an Install formula or cask field, an Update All button that shows the outstanding count, and per-row Update / Uninstall actions. The AI Administrator can drive the same flow with its install_homebrew and install_package tools, again through the in-app console where you enter your password.
2.6The Command-Line PATH pane
FrontierStack detects installed tools by resolving them the way your shell does. Occasionally a tool you've installed (via pip, pipx, a virtualenv, or a non-standard prefix) isn't on the PATH the app sees, so it reports the tool as missing. The Command-Line PATH pane fixes that.
- Pick your shell profile (for example
~/.zprofile). Directories you add are written to a clearly marked managed block in that file and prepended to your PATH — open a new terminal to pick up the change. - Directories to add lets you add a path by typing it or with Choose…; the top entry is searched first. Current PATH (effective) shows your login shell's PATH, tagging entries the app manages.
- PATH Doctor diagnoses why a tool isn't detected: enter a command (e.g.
mlx_lm.server,gcloud) and it reports whether the app finds it, whether only your shell finds it, or whether it isn't installed at all — with a one-click Add to managed PATH for any directory the app is missing.
2.7The Install Wizard
If you're starting from scratch, the Install Wizard (in the sidebar) is the fastest way to a working stack. Pick a target use-case — WordPress/PHP, Full-Stack JS, Python/Django, Rails, static site, database, or reverse proxy — and the wizard pre-selects the recommended components (web server, database, cache) for that goal. Adjust the selection to taste, then it installs everything through Homebrew.
The same pane shows the status of the native Apache + MySQL + PHP stack at a glance, and detects all-in-one bundles already on your Mac — XAMPP, MAMP, AMPPS, Local. If it finds one, it routes you to Migrate Setups rather than installing a parallel stack, so you don't end up running two of everything.
2.8Migrating an existing stack
If you already run sites locally under MAMP, XAMPP or Apple's Server.app, you don't have to rebuild them. The Migrate Setups pane detects those stacks and brings their pieces into FrontierStack's native Homebrew stack: web files, MySQL databases, PHP settings, and the Apache vhosts that define each site.
- Open Migrate Setups. It scans for installed sources — MAMP / MAMP Pro, XAMPP and Apple Server — and reports what it found: the sites, the database, and whether PHP was detected. (The AI Administrator's
detect_migration_sourcestool runs the same read-only scan.) - Review the Sites to import list. Each candidate shows its server name and listening port; anything that can't be brought across cleanly appears under Skipped with the reason.
- For settings, the Import All Settings action copies the source's
php.ini,my.cnfandnginx.confover the matching Homebrew config. A.pre-mamp.bakbackup of each file is kept so you can compare or revert. - Choose Import Selected to run the migration. Live progress is shown in the pane as it installs the needed Homebrew services, copies web files, migrates the MySQL databases and imports the vhosts.
- Review afterwards. Source configs often reference the old tool's paths and ports (for example MAMP's
extension_dir,datadir,socket, or port8889), so check the imported settings before relying on them.
The AI Administrator can drive this end-to-end with run_migration, but only after detecting sources and confirming with you — and only with changes enabled.
.pre-mamp.bak backups cover config files, not your databases.2.9Where your data lives
FrontierStack keeps its own state in predictable, standard places, so you always know what it touches and can back it up:
| What | Where |
|---|---|
| App settings & data | ~/Library/Application Support/FrontierStack/ |
| Secrets & tokens | The macOS Keychain, under service jp.co.enfour.frontierstack |
| App-managed Apache config | /opt/homebrew/etc/httpd/frontierstack/ — a dedicated directory the app owns, kept separate from any hand-edited Apache config |
| App logs | ~/Library/Logs/FrontierStack/ |
Keeping the app's Apache config in its own frontierstack/ directory means FrontierStack can manage vhosts safely without clobbering configuration you maintain by hand. The bundle identifier is jp.co.enfour.frontierstack (the helper and DDNS components use the .helper and .ddns suffixes).
With the app installed, the helper decided, Homebrew in place and any old stack migrated, you're ready to actually use it. Chapter 3, The Interface tours the window in detail: the sidebar, panes, search, the menu bar, and the controls you'll reach for every day.
Chapter 3
The Interface
One window, a thousand services. This chapter is the guided tour: the sidebar, the panes, the floating palettes, Search, Help and the small touches that keep the app out of your way.
FrontierStack manages an enormous range of services, yet it presents them through a single, familiar macOS window: a sidebar of things on the left, the screen for the selected thing in the centre, and a row of always-available tools in the toolbar. Learn this layout once and every pane in the book — from Apache to a Cloudflare zone — sits exactly where you expect it. This chapter walks the interface end to end so the rest of the manual can simply say "open the Sites pane" and trust that you know how.
3.1The main window
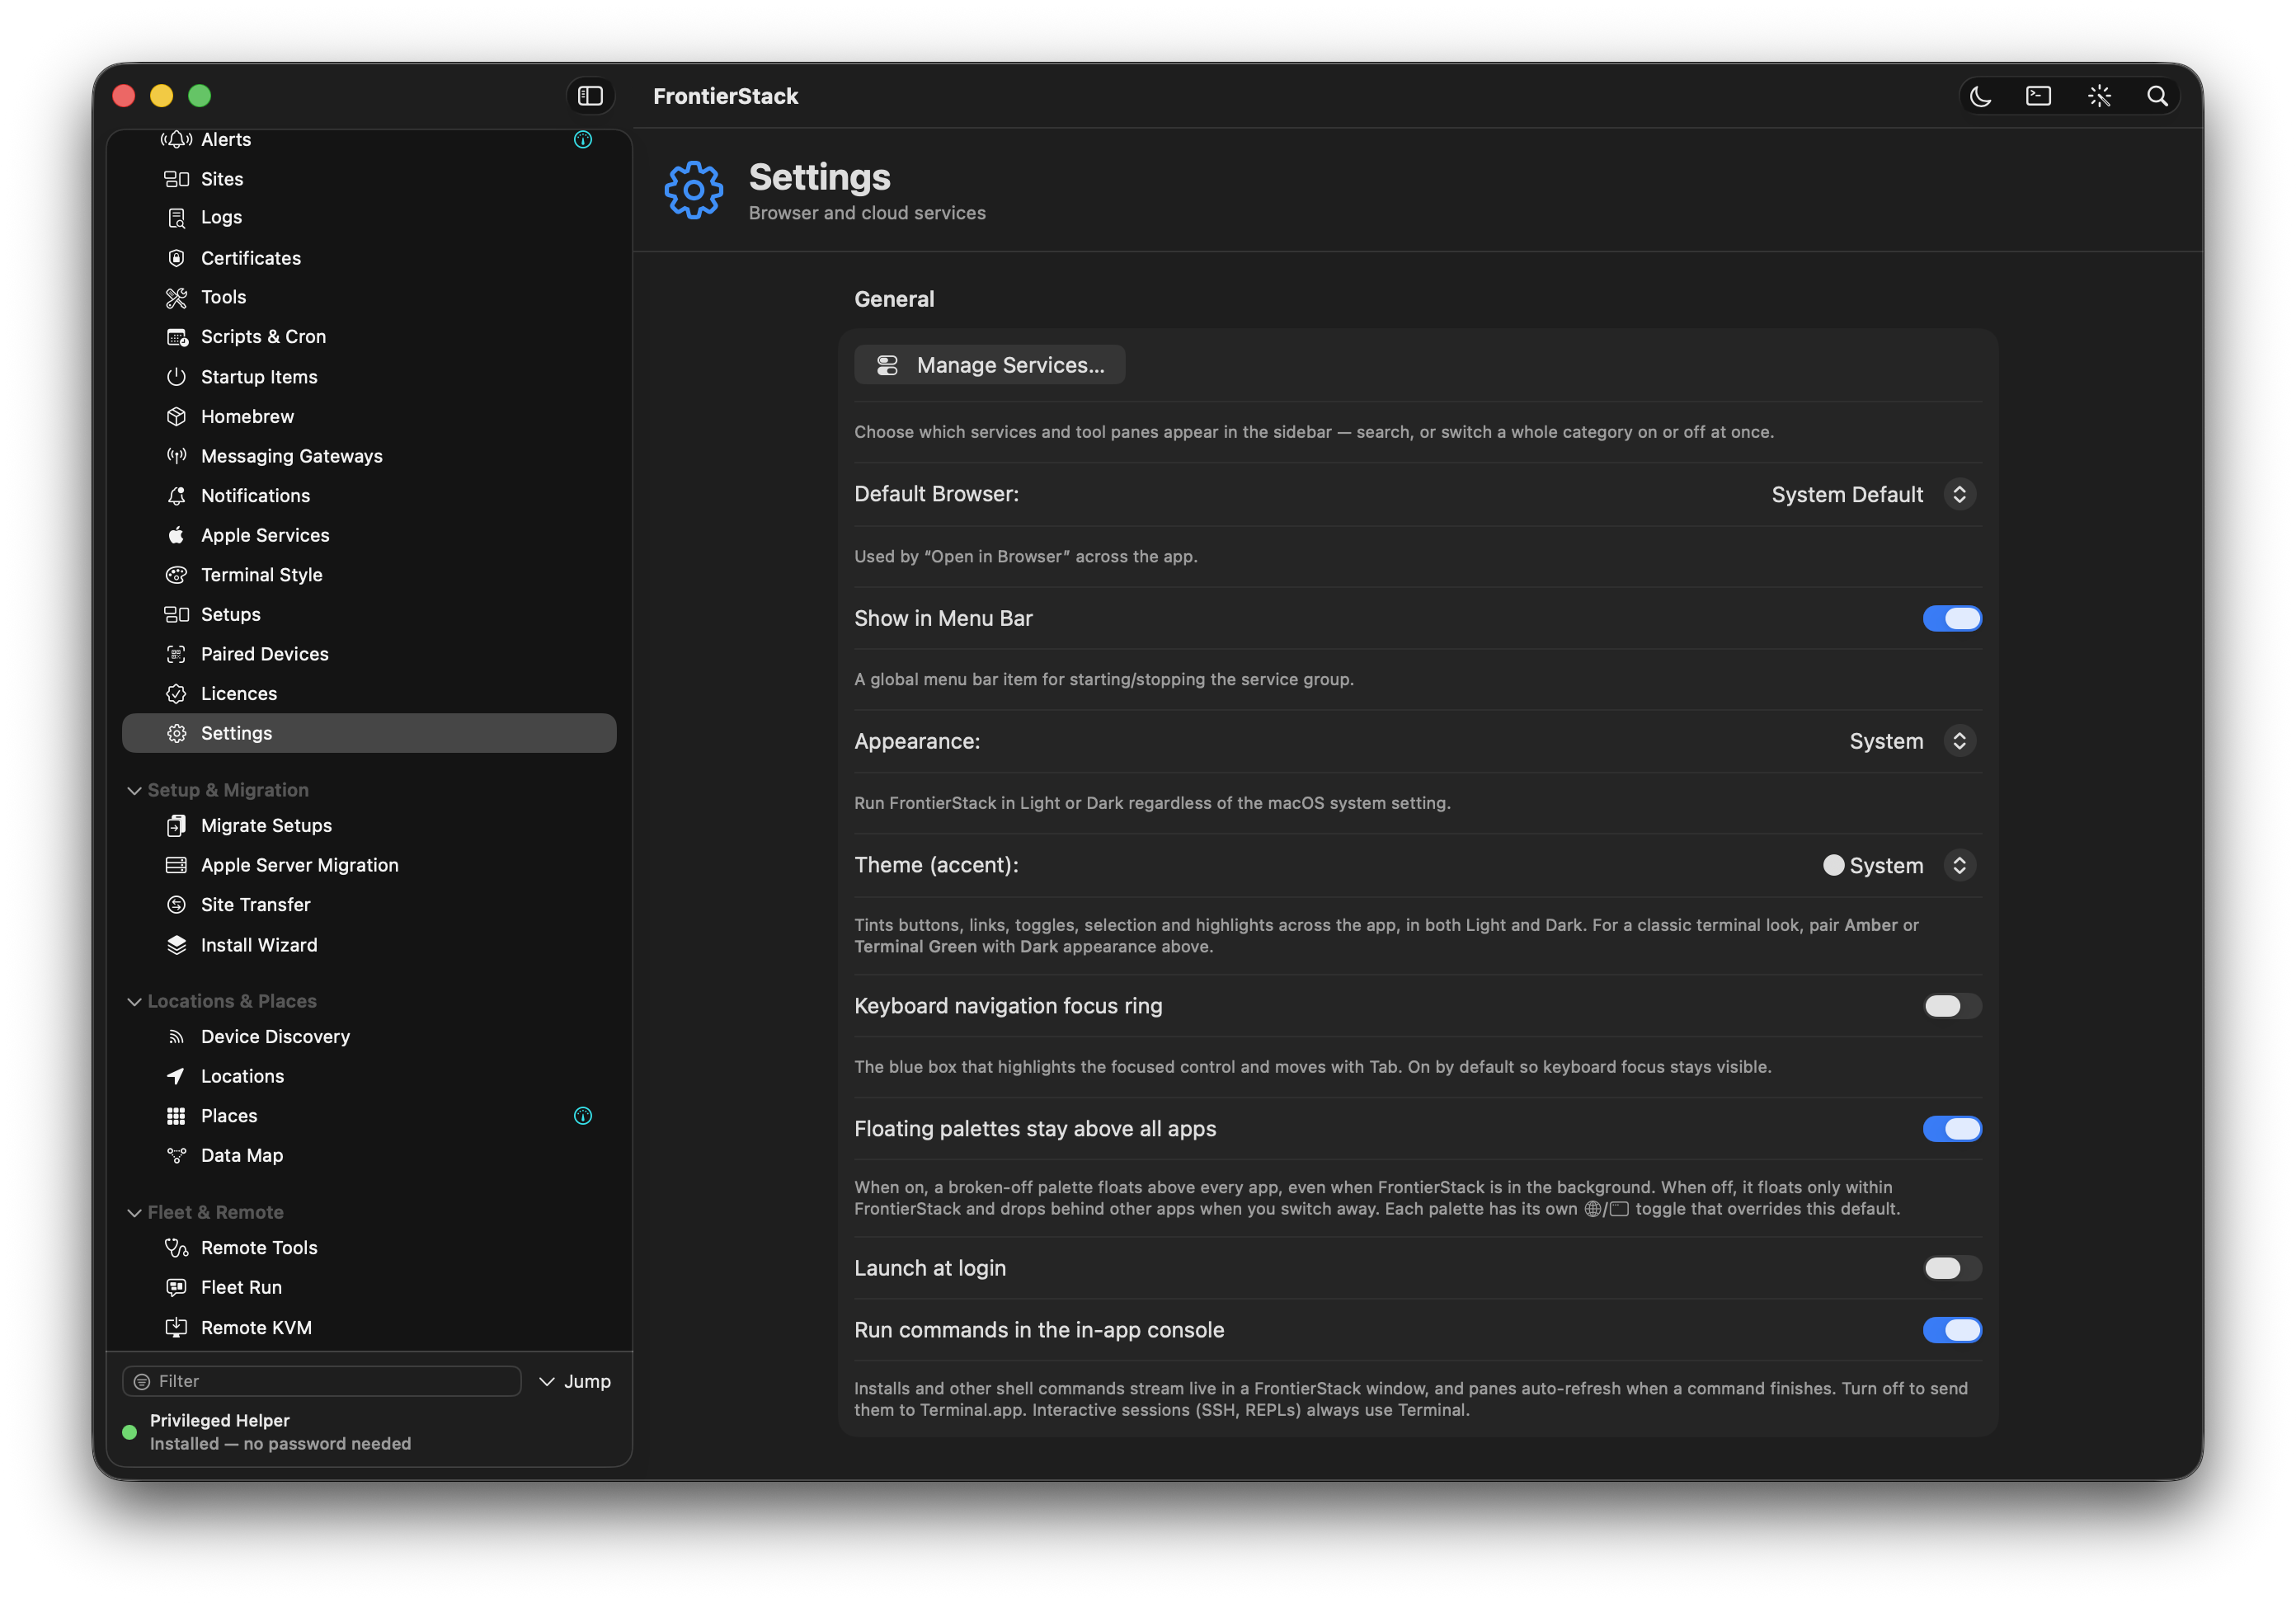
The window is a standard macOS NavigationSplitView with three regions. On the left is the service sidebar: a scrollable, collapsible list of every service and tool you have chosen to see, grouped into categories. In the centre is the active pane — the screen for whatever you selected in the sidebar, with its own header, tabs and controls. Running across the top is the toolbar, whose buttons are available no matter which pane you are in.
From right to left, the toolbar holds: Search (the magnifying glass, also ⌘F); the AI assistant (the wand, which opens the floating command palette); a Shell button that drops a terminal into the current working directory; a Dark mode toggle that forces dark even when macOS is in light; and, when the selected pane can be floated, a break-off button to pop it out as a palette. If you have unsaved changes to a Setup, an orange Unsaved menu appears here too.
The sidebar's width is yours to set — drag the divider and FrontierStack remembers it across launches. Your last-selected pane is restored when you reopen the app, so you return to where you left off.
Sidebar groups tame a sidebar that spans several sites or companies. Right-click any pinned server, device, Cloudflare zone, Wi-Fi network or cluster and assign it to a group ("Osaka office", "Acme Corp"); group rows at the top of the sidebar then switch between the sets, showing the active group's items plus everything ungrouped — grouping is optional, and ungrouped items are always visible. A red count on a non-active group warns that something hidden inside it has a problem, and a group linked to a Location activates itself when you arrive on that network. The iPhone app mirrors the same folders in its Fleet tab.
3.2The service sidebar
The sidebar is organised into two tiers. At the top sits Overview — the app's own built-in tools: Local Health, Status Page, Alerts, Domains, Logs, Certificates, Notes, Scripts, Setups, Settings and more. Below it, one section per service category — Web Servers, Databases, Caching, Mail, Networking, Security Tools, Containers, AI and dozens more — each listing the services you have chosen to show from the catalog (Chapter 6). Every section header is a chevron you can click to collapse, and the app remembers which groups you leave folded.
Each service row shows a status dot when it is running. Right-click a service for two quick actions: Pin to Top of Section keeps a service you touch often at the top of its category, and Hide removes it from the sidebar. Hiding never uninstalls anything — the service keeps running and stays reachable from Search; it just stops cluttering the list.
Below the categories, the sidebar grows extra sections for the things you pin elsewhere in the app: linked servers (each with little category icons showing which services it runs), monitored Wi-Fi networks, Cloudflare zones and Kubernetes clusters. Type in the filter field at the top of the sidebar to narrow every section at once.
3.3Presets and Setups
Two features shape what the sidebar shows. The Presets menu (in the menu bar) is the fast way to load a whole use-case at once. Its Base — show services for… section swaps the sidebar to a curated set for a scenario (a web stack, a mail server, a shop), while Add to current view… layers an extra group onto what you already have. Show All reveals everything; it is the escape hatch when you cannot find something.
Setups go further: a Setup is a named snapshot of your whole working view — which services are hidden, which are pinned, and the floating palettes you have open and where they sit. Save one from Presets ▸ Save Current as Setup… (or from the Setups pane), then flip between Setups from the top of the Presets menu; the active one carries a check mark. The palette layout auto-saves into the active Setup as you move windows around, so a Setup always reflects how you really work. Change which services are shown and the Setup goes dirty; the toolbar shows an orange Unsaved badge with Update, Save as New and Revert.
A Setup can also be bound to a Location (Chapter 8). Bind your "Office" Setup to your office network and FrontierStack switches to it automatically when you arrive — the right services, the right palettes, for where you are.
3.4Floating palettes and mini-palettes
Sometimes you want to keep one screen visible while you work elsewhere. Any monitor-style pane can be broken off into a floating palette: a small, always-on-top utility window built on macOS NSPanel, so it stays above the main window and other apps. Use the break-off button in the toolbar (or ⌘⌥⇧W to close the front palette). Local Health, Containers, Cloud Servers, the Wi-Fi Analyzer and others all float.
For an even lighter footprint there are mini-palettes — compact, glanceable summaries rather than the full pane. Minis exist for Local Health, Cloudflare Zones, Wi-Fi, Printers, Router & Network, Containers, Scripts, Message Delivery and AWS. Each mini row has a button to open the matching pane in the main window when you need the detail. Open palettes are part of a Setup, so a saved view restores your floating windows exactly as you arranged them.
3.5The command and AI palette
The wand button in the toolbar opens the AI assistant palette — a draggable, always-on-top NSPanel with a single ask-anything field ("why is my site down?", "tune MySQL", "show only what I use"). It is the same AI Administrator covered in Chapter 13, surfaced as a floating window you can keep beside whatever you are doing. Like every floating palette it stays above the main window; unlike the others it talks back, proposes fixes and — with your approval — acts. It carries its own conversation history and an approval card for any mutating action, so nothing runs until you say so.
3.6The menu-bar item
FrontierStack can place a small item in the macOS menu bar (toggle Show in Menu Bar). It is the quickest way to act without bringing the whole window forward. From it you can Start or Stop your startup group, Restart any of the core servers (Apache, Nginx, PHP-FPM, MySQL, Postgres) or everything running at once, refresh status, set Launch at Login, and open or quit the app.
The Localhost section lists what this Mac is actually serving right now: each entry is a web UI found by probing the ports that really have a listener (dev servers such as Vite on any port, admin consoles, Apache or Nginx on 80/443), and one click opens it in your browser. A port published by a running Docker container shows the container’s name, and a Containers running row jumps straight to the Docker pane. The list refreshes each time the menu opens; Refresh Status forces a new scan immediately.
3.7In-app Search
Search (the magnifying glass, ⌘F) is the fastest way to reach anything. Start typing "search services, tools & actions…" and the palette matches panes, tools, services and actions as you go — including services you have hidden from the sidebar. Pick a result and the app navigates straight to it. A Semantic mode lets you search by meaning ("block an IP", "free up disk") rather than exact names, so you can find a capability without knowing what FrontierStack calls it.
3.8The Help window
Open Help with ⌘? for a dedicated FrontierStack Help window. It is a real book of in-app documentation, organised to mirror the app. Help is more than reading: its pages carry Open in app links. Click one and FrontierStack jumps the main window to that exact pane or service — the Help window stays open beside it, so you can read a procedure and follow along step by step. Many panes have a small help button in their header that opens Help at the matching topic.
3.9The Notes pane
Notes is your private place for credentials, runbooks and per-service instructions. Each note has a title, a service tag and a body, and the whole thing is encrypted in the macOS Keychain — not stored in plain files. The defining feature is the per-note lock: every note carries a Share with AI Administrator toggle that is off by default. While a note is locked, the AI literally cannot read it. Unlock a note only when you want the assistant to use those credentials or steps; it then appears in the AI's list_notes and can be read on demand.
3.10The Status Page
The Status Page pane publishes a static index.html built from the same up/down data as Local Health, so customers or colleagues can see what is running without access to the app. Choose a destination — a folder inside one of your Apache sites' DocumentRoots, so it is served at a path like /status/ — set a page title, and decide whether to Include item details (leave detail lines off for a public page, since they can reveal internal hosts and ports). The page regenerates on an interval you set, or on demand with Generate Now. Serve with picks Apache or the built-in server (a bundled static file server on a port of your choice, localhost or LAN), and Launch keeps that server running at login or at system start so the page outlives the app. A Servers section can list pinned servers with monitors, kept live even while the app is closed, and Internet access offers persistent routes (Cloudflare Tunnel, Tailscale, router port-forward with Dynamic DNS). Chapter 11 has the details.
3.11Local Health and Locations at a glance
Two Overview panes anchor everyday use, and each has a full chapter of its own. Local Health is the board that answers "is everything OK?": every monitored service, device and subsystem with an UP or DOWN state and a one-line summary. You mark items as critical from their own panes to add them to the board, and it doubles as a floating palette and a mini. Its full treatment — the health sweep, thresholds and how it drives alerts — is Chapter 11.
Locations teach the app where your Mac is on the network right now — Home, Office, On VPN — matched from the Wi-Fi network or subnet. Locations make monitoring network-aware: while you are somewhere unrecognised the app treats you as Away and pauses location-scoped checks, so a café or hotel network never sets off false alarms. They also bind Setups, as we saw above. The complete model — defining locations, scoping alerts and reachability, the fleet — is Chapter 8.
With the layout learned, you are ready to put it to work. The next part of the manual opens the panes themselves, starting with Chapter 4, The Web Stack.
Part II
Running the web stack, databases, the service catalog and your sites on the Mac in front of you.
Chapter 4
The Web Stack
Apache or Nginx, the PHP version each site needs, virtual hosts, trusted local HTTPS and DNS — the whole web stack, controlled from one window with no hand-edited config.
A web server is the heart of most self-hosted setups, so FrontierStack treats it as a first-class citizen. The Apache pane installs, starts, validates and configures a Homebrew Apache; the PHP, Localhost, Certificates and DNS panes round out a complete development and hosting stack — and every change goes through validation so a typo never takes a site down silently.
This chapter covers the panes that make and run web sites on the Mac in front of you. Connecting that stack to a real domain and the public internet is Chapter 7; tightening it for production is Chapter 10.
4.1The Apache pane
Open the Apache pane from the sidebar to see your web server’s state at a glance: version, whether it is running, and the ports it listens on. The buttons across the top are the controls you reach for daily — Start, Stop, Restart and Validate Config. Validation runs apachectl -t (a real syntax check) and shows the result in Last Result, so you can confirm a change is sound before you reload.
FrontierStack recommends a Homebrew Apache rather than the macOS system copy. The Homebrew server lives under /opt/homebrew (or /usr/local on Intel Macs), runs as you through brew services without a root prompt for every action, and is not locked down by System Integrity Protection — so a current mod_php loads cleanly and the whole stack stays on one toolchain. The system Apache under /etc/apache2 is wiped by OS updates and ties you to Apple’s bundled libphp. If Homebrew Apache is not installed, the pane offers Install Homebrew Apache… in one click.
If you keep several Apache builds — the Homebrew one, a legacy local build, or a remote server’s — the binary picker (see Add Homebrew Apache / Add Local Build…) lets you register and switch between them, each with its own version and ports shown.
/opt/homebrew/etc/httpd/frontierstack/, pulled in by an IncludeOptional from httpd.conf. Keeping the app’s vhosts, MIME types and managed includes there means your hand-written httpd.conf stays clean and you can always tell what FrontierStack added.4.2Modules, ports and the managed config
Lower in the Apache pane are the parts of the config you most often edit, each surfaced as a control rather than a file:
| Section | What it does |
|---|---|
| Ports | Set the HTTP and SSL listen ports (default 80 and 443). Move Apache off 80/443 if Nginx is using them. Apply rewrites the Listen directives and reloads. |
| Apache Modules (Modules…) | List loaded modules and enable or disable them. Disabling an unused module is the simplest hardening step you can take. |
| PHP Module | Choose which version’s mod_php (libphp.so) Apache loads for websites — see the next section. |
| WebDAV | Enable mod_dav for a shared folder, with optional Basic-auth user, written into a managed include. |
| Edit MIME Types… | Add or remove AddType mappings in a FrontierStack-managed MIME file, never touching the distro’s mime.types. |
For anything not exposed as a control, the config rows give you Edit Managed Config… (the FrontierStack include) and Edit httpd.conf… (the main file) directly. Every save validates with apachectl -t, reloads gracefully, and rolls back if the new config does not parse — so a bad edit is caught before it can break the running server.
httpd.conf by hand is powerful and unguarded. The app validates and rolls back on a syntax error, but a config that parses yet points a document root at the wrong place can still expose files. Prefer the managed include for FrontierStack’s own additions, and keep a copy of any large change.Toggling a module rewrites its LoadModule line and revalidates. If a change leaves httpd -t failing — the classic case is enabling proxy_fcgi without proxy, which the app now auto-enables for you — the Modules window shows the error and won’t close silently: you either correct it or choose Save anyway. When Apache is wedged and won’t start (the classic Homebrew Bootstrap failed: 5: Input/output error, from a service that was already loaded, or from sudo brew services leaving some httpd paths owned by root), the pane’s Recovery & reset section offers three escalating fixes: Restart cleanly (stops httpd in both the user and system launchd domains, then starts it once), Reset config to default (backs up your httpd.conf and restores Homebrew’s), and Remove & Reinstall (clears the root-owned paths and reinstalls the formula). All run in the in-app console so you see the sudo prompt and output. If Service Watchdog keep-alive is also on for Apache, it may restart httpd on its own — expected, but pause it if it fights a manual recovery.
4.3Choosing the PHP version
Open the PHP pane to manage the PHP runtimes installed on the Mac. Homebrew lets several major versions live side by side (for example [email protected] through the current release), and FrontierStack treats them as a set you switch between rather than a single global install.
Version ▸ Add Version… installs another version alongside the ones already there — nothing is replaced, and the version you are using does not change. The list has two parts. Homebrew’s own releases are the ones still supported upstream. Below them sit the end-of-life builds — PHP 8.0 back to 5.6 — which PHP itself no longer patches and Homebrew has dropped; FrontierStack fetches those from the community shivammathur/php tap, and asks you to confirm each one first, because installing from a tap means running that tap’s own code. Keep an end-of-life PHP for testing or maintaining a legacy site on your own machine, and never point the public internet at it.
There are two distinct choices:
- The Apache module. In the Apache pane’s PHP Module section, the Load for websites picker chooses which version’s
libphp.soApache loads. Changing it rewrites the managed config and reloads Apache. - Per-site PHP. A local dev server (the Localhost pane, below) has its own PHP Version picker listing every installed version, so one project can run on an older PHP while another runs on the latest — without changing what the rest of the machine uses. This is the usual way to keep a legacy app and a new one happy at the same time. It applies to both local runtimes: the PHP built-in server and the Apache runtime. One caveat for Apache, which serves through
mod_php: a version is only usable there if its keg shipslibphp.so, and the editor tells you when the one you picked does not. When it does not, run that site on the built-in server, or serve it through PHP-FPM.
The Runtime Health pane gives the wider picture — PHP alongside Python, Node.js, Java, Go, Rust, Ruby, Perl and .NET — with a self-check that flags a missing or end-of-life runtime before it bites you.
The Runtimes section also carries a React pane for front-end work. It scaffolds a new app (Vite, TanStack Start or Next.js), points at any React project, and offers a curated companion-library list filed by the job each does — state management (Zustand, Jotai, Redux Toolkit), data fetching and server state (TanStack Query — the library formerly called React Query — and SWR), full-stack frameworks (TanStack Start, Next.js), routing, validation (ArkType, Zod), forms, and authentication (Clerk). Each row shows its docs, whether the selected project already uses it, and a one-click npm install into that project.
4.4Sites and virtual hosts
The Websites list in the Apache pane is where you manage virtual hosts. Each row shows the site’s name, the bind address and the port (for example :8080), and a Running toggle for its live status. The buttons let you Add Site…, edit, duplicate, disable, Push to Server… (copy a vhost to a linked server), and open the site in a browser. Import Sites… and Copy from… pull existing vhosts in from MAMP, XAMPP, Apple’s Server.app or another Apache, bound to localhost by default.
Adding or editing a site, you set the essentials a vhost needs: its ServerName (the domain), the document root (Choose… a folder), and the bind address and port. Enable the site and it appears in the list with a live status dot; FrontierStack writes the vhost into a .conf file under the managed tree, validates, and reloads. To create the vhost, certificate and a Cloudflare DNS record together, use New Site + DNS… — the one-flow wizard described in Chapter 7.
127.0.0.1 while you develop and it is reachable only from your Mac — the safest default for work in progress. Move the bind address to 0.0.0.0 or a LAN IP only when you genuinely want other machines to reach it.4.5TLS certificates for sites
The Certificates pane issues and manages the certificates that put the padlock on your sites. It offers three paths, suited to different needs:
| Method | Use it for |
|---|---|
| mkcert (Get Certificate (mkcert)) | Trusted local HTTPS. mkcert installs a local certificate authority your Mac trusts, so https://myapp.test works with no browser warning — ideal for development. Install mkcert sets it up first. |
| Let’s Encrypt (ACME) | Public, browser-trusted certificates for real domains, via acme.sh or certbot. Issue by webroot (the domain already serves HTTP) or by DNS-01 via Cloudflare (no inbound HTTP needed). Renew All Now and a renew cron keep them current. |
| Create Self-Signed Certificate | A quick certificate for internal or testing use where a browser warning is acceptable. |
Once issued, Deploy to Apache wires the certificate into the site’s vhost. The Expiry Monitoring section watches your certificates (and any domain you add with Watch) and alerts you well before they lapse — the deeper hardening story, including HSTS and modern cipher policy, is in Chapter 10.
CF_TOKEN vault secret and injected at run time; it is never sent to a cloud AI.4.6The .htaccess editor
Per-directory Apache rules — rewrites, redirects, access control — live in .htaccess files, and FrontierStack gives them a dedicated editor with line numbers and a syntax sanity check. Open a site’s document-root .htaccess with Use Site Root, or point it at a custom path. Insert Recipe drops in common, correct snippets (a front-controller rewrite, a force-HTTPS block) so you start from working rules rather than memory, and the editor flags obvious problems before you save. Export PHP Router… turns .htaccess rewrite rules into a router file for a built-in PHP dev server — useful when you move a site to the Localhost pane.
4.7Nginx and reverse proxies
FrontierStack manages Nginx as an alternative web server or a reverse proxy in front of an app. When both are installed, the Domains view groups your sites by server — Apache virtual hosts and Nginx server blocks side by side — reading each Nginx server block’s listen port, root and TLS state. A reverse proxy is the standard pattern for fronting an application that speaks HTTP on a high port (a Node, .NET or Python service): Nginx terminates TLS on 443 and forwards to the app. Because Apache and Nginx both want 80/443 by default, use the Apache pane’s Ports section to move one off those ports if you run them together.
4.8Localhost, DNS and dev stacks
Three more panes complete the local picture:
- Localhost — a manager for ad-hoc local dev servers. Add a New Local Server, pick a Runtime (PHP, Python/Django, Node/Vite…) and folder, set a port and an optional
ServerName, and Start it — with per-server Environment Globals and a .test resolver somyapp.testresolves locally. A Free Port helper and a stop whatever is holding localhost action clear the usual conflicts. Tick Also serve on Tailscale to reach a server from your other Tailscale devices at this Mac’s tailnet address on the same port — the server still listens on localhost only and FrontierStack forwards tailnet connections to it, so the LAN can’t reach it. For a Django server, Allow Tailscale Host… adds the tailnet address to the project’sALLOWED_HOSTSafter showing you the change (or hands you the line to add, when the setting is built from environment variables). The AI Administrator (and an agent over MCP) can start a folder the same way withdebug_shareactionserve; the reply names the localhost host and port and, when asked, the Tailscale URL, so the agent can report where the site is running. - DNS — local name resolution and authoritative hosting. Run
dnsmasq,unboundornsd; import and export zone files; and flush the resolver when records change so the Mac stops serving a stale answer. - LAMP / DevStacks — one-click stacks. The LAMP pane offers presets (Choose a Setup) that install and start a matched set of components together (Install & Start, Start All, Stop All); DevStacks detects the framework of a project folder and shows the right commands and npm scripts to run it.
An Localhost overview shows every local server you have running, side by side, so you can run many sites at once without a wall of Terminal windows to babysit.
vhost_create makes a virtual host, reload_webserver tests and gracefully reloads Apache or Nginx, and issue_certificate obtains a Let’s Encrypt certificate. They are mutating tools, so each shows an approval card and requires changes to be enabled — the AI does exactly what you would do in these panes, and nothing it has not been allowed to.Chapter 5
Databases & Data
Run MySQL, PostgreSQL, Redis and the rest from one window; let the AI inspect and fix a site's database; and keep every byte backed up, verified and restorable.
A web stack is only as good as the data underneath it. FrontierStack treats databases as first-class services: it installs and runs them, browses what is inside, lets the AI Administrator inspect and repair a site's database in plain language, and — the part most setups forget — backs everything up on a verified schedule that you can actually restore from. This chapter covers the relational engines, the in-memory caches, the newer vector and analytics stores, and the backup machinery that protects them all.
5.1The MySQL / MariaDB pane
Open MySQL from the Databases section of the sidebar. The pane installs the server through Homebrew if it isn't present, then gives you the controls Server.app used to: Start, Stop and a live status light, the listening port (default 3306), and a list of the databases on the server. MariaDB — the drop-in MySQL-compatible fork — is managed the same way; the pane recognises whichever is installed.
Local development follows one deliberate convention: the local root account has no password. This is the MAMP/XAMPP norm and it is what makes one-click setup and the AI's SQL tools work without a credential prompt. It is safe precisely because MySQL on your Mac listens only on 127.0.0.1 and is reachable only from the machine itself. The moment a database needs to be reached from elsewhere — a passworded account, or a database on a linked server — you switch to the secret vault, described below.
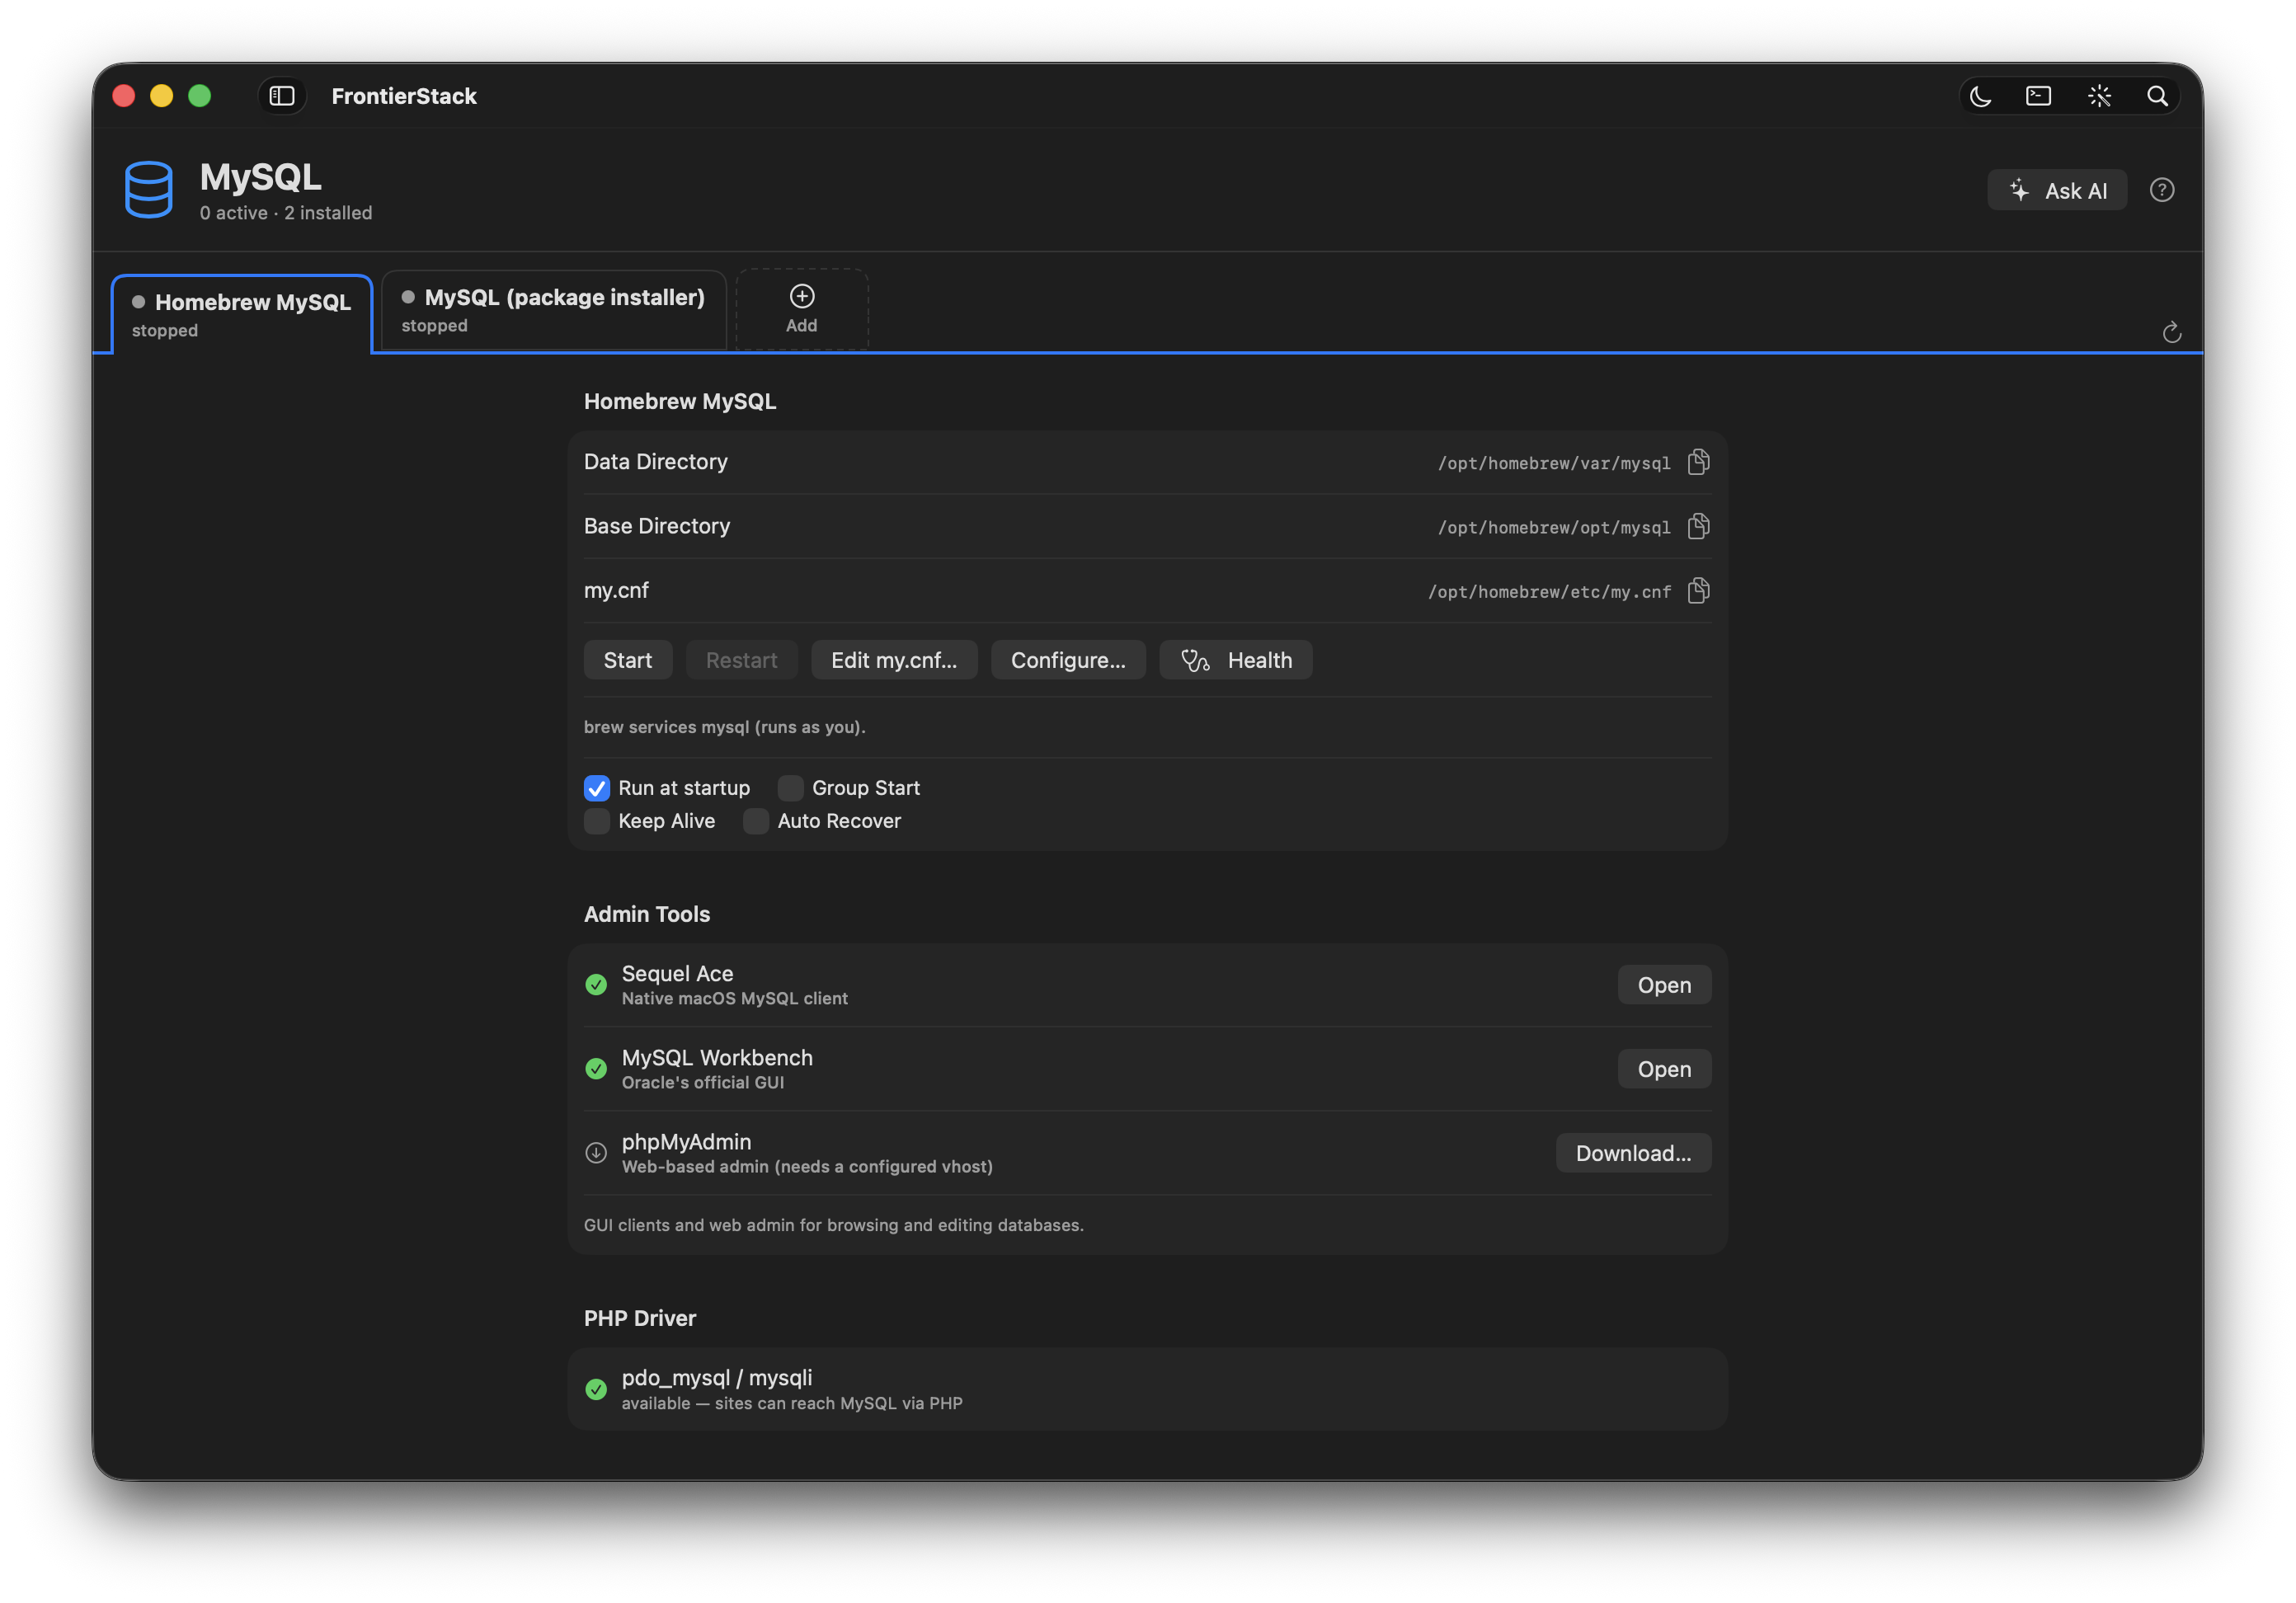
root applies only to MySQL bound to localhost on the Mac in front of you. It is a development convenience, not a recommendation for any server that accepts connections from the network. Production databases get a real password and live in the vault.5.2Database Ops and running SQL
The Database Ops pane is where databases stop being a black box. Its Replication section detects whether a configured server is a MySQL replica or a PostgreSQL standby and shows the lag: MySQL reads SHOW REPLICA STATUS (IO and SQL threads, Seconds_Behind_Source); PostgreSQL uses pg_is_in_recovery() and the replay timestamp. Stopped replication, or lag past your threshold, raises an alert on your channels — the basis of the Database Slave monitoring preset.
For inspecting or fixing data, the AI Administrator carries a run_sql tool. Ask it in plain language — "why are these orders showing the wrong total?", "delete the duplicate users older than the originals" — and it runs SQL against the local server and shows you the result as a table, much like MAMP's Claude integration. Because statements can modify data, run_sql requires changes enabled; read-only queries work the moment the assistant is on. It defaults to local root with no password and is local-only by design.
5.3Passworded and remote databases
The local-root shortcut stops exactly where the network begins. For a database that needs a password, or one on a remote or linked server, you never paste the password into a prompt or a tool. Instead you add it once to the AI Administrator's Script secrets (.env) bar as a named secret — DB_PASSWORD or MYSQL_PWD — and the assistant runs the mysql client through run_script, referencing the value as $DB_PASSWORD and running it over SSH against the named server. The real value stays on your Mac and is injected at run time; the cloud model sees the name, never the secret.
.env vault and reference it as $NAME. The value is injected locally or over SSH at run time and is never sent to the AI. This is the same vault model used throughout FrontierStack — see Chapter 13.5.4PostgreSQL
Open Postgres for projects that want advanced SQL, rich JSON, full-text search or GIS. The pane installs and runs PostgreSQL (default port 5432) and sits alongside MySQL with the same start/stop/status controls. Choose PostgreSQL when your application or framework expects it; otherwise MySQL/MariaDB remains the easy default. Both engines are first-class targets for the backup jobs and AI tools described later, and PostgreSQL is the foundation for several of the specialised stores below — pgvector for embeddings, TimescaleDB for time-series, and PostgREST for an instant REST API over a Postgres database.
5.5Redis and other caches
Sessions, queues, rate limits and hot-path caching usually want an in-memory store rather than a relational table. FrontierStack runs the two standards from the Caching catalog: Redis (port 6379), the in-memory key-value store that also backs Redis Streams, and Memcached (port 11211) for a simple distributed cache. Install, start and monitor them like any other service. Most CMS and framework deployments pair Redis with MySQL or PostgreSQL; the Service Catalog (Chapter 6) lists every option.
5.6Vector and analytics databases
Two newer families of store get their own catalog categories. Vector databases hold embeddings for retrieval-augmented generation (RAG) and semantic search; they are how the AI stack (Chapter 15) gives a model access to your own documents. Analytics databases are columnar or time-series engines built for fast aggregation over large datasets rather than transactional reads and writes.
| Engine | Kind | Port |
|---|---|---|
| MySQL / MariaDB | Relational | 3306 |
| PostgreSQL | Relational | 5432 |
| Redis | In-memory cache / streams | 6379 |
| Memcached | In-memory cache | 11211 |
| Qdrant | Vector (RAG / embeddings) | 6333 |
| Chroma | Vector (embeddings) | 8000 |
| Weaviate | Vector (hybrid search) | 8080 |
| Milvus | Vector (distributed) | 19530 |
| pgvector | Vector (Postgres extension) | 5432 |
| ClickHouse | Columnar OLAP analytics | 8123 |
| InfluxDB | Time-series | 8086 |
| TimescaleDB | Time-series (Postgres ext.) | 5432 |
| Apache Druid | Real-time OLAP | 8888 |
For purely in-process vector search there is also FAISS (a library, no port). Pick the engine your framework expects; the panes install and run each one through the same catalog machinery.
pgvector keeps that inside an existing PostgreSQL; Qdrant, Chroma, Weaviate and Milvus are dedicated stores for larger collections.5.7Data pipelines & ETL
Moving and reshaping data between these stores is its own discipline. The Data Pipelines & ETL catalog category covers it at the overview level: Airbyte and Meltano for extract-load with hundreds of connectors, dbt for SQL-based transformation and modelling, and orchestrators such as Dagster, Prefect and Kestra for scheduling the work. These are full platforms; FrontierStack installs and runs them and surfaces their web UIs, but the pipeline logic lives in each tool. For programmatic data-pipeline DAGs there is also Apache Airflow in the Workflow Orchestration category.
5.8Backups: dumps, the overview pane, and CCC
A database with no tested backup is a future outage. FrontierStack approaches this from two directions. In Database Ops you define a verified dump schedule per server: name, engine (MySQL or PostgreSQL), host, port, user, database (blank = all) and a backup directory. Due jobs run automatically while the app is open, and Run Now triggers one immediately. Each run does more than dump — mysqldump runs with --single-transaction for a consistent InnoDB snapshot, then Verify checks gzip integrity and that the dump ends with its completion marker (catching truncated or half-written files), writes an .md5 sidecar, rotates to your keep count, and rsyncs the result offsite over key-based SSH.
The AI Administrator exposes the same operations as tools: db_dump dumps a database to a .sql file on the target (using mysqldump or pg_dump), and backup_now makes a timestamped tar.gz of configs, a site or a data folder. Both are mutating, so they require approval and changes enabled; for the DB password they reference a $NAME vault secret, never a pasted value.
The Backups overview pane rolls up every mechanism so staleness is obvious at a glance: Time Machine status, Carbon Copy Cloner tasks, app-managed Apache config snapshots, config version history in Git, and scheduled auto-exports. The Carbon Copy Cloner pane reads CCC's tasks and history through its ccc command-line tool and lets you Run a task on demand. Both Time Machine and CCC feed the Alerts engine — a backup that hasn't run within its threshold, or a failed CCC task, raises an alert on your channels (Chapter 11).
The app's own settings are covered as well. The sidebar's pins and hidden services, saved Setups and network Locations are kept in JSON files in the app's support folder rather than only in macOS preferences; every Git snapshot carries them together with a copy of the preferences, and an hourly shadow copy of the preferences means a wiped preferences file is put back automatically at the next launch. Restore App Settings… under Config version history restores them by hand from the latest snapshot.
5.9Restore — and restore safety
Backups exist to be restored, and restore is the dangerous half. The AI's restore tool extracts a .tar.gz archive or imports a .sql dump into a database. Because importing a dump overwrites the live database and extracting an archive overwrites files in place, restore is mutating and potentially destructive: it always requires explicit approval with changes enabled, and SQL imports reference the DB password as a $NAME vault secret.
.sql dump replaces the current contents of the target database, and there is no automatic undo. Before any restore, take a fresh dump of the current state (db_dump or Run Now) so you can roll back, and confirm you are pointed at the right database and the right server — not production by mistake.5.10Recovering a broken database
Sometimes a database is worse than down — it won't start, or a table is corrupt. FrontierStack gives the AI Administrator (Chapter 13) the same tools you would reach for by hand, behind the usual approval card. mysql_check_tables and pg_check_tables run mysqlcheck / pg_amcheck to find corrupt or crashed tables; with repair on they take a mysqldump/pg_dump backup first, then repair (--auto-repair / REINDEX), so a fix is reversible. mysql_service_control and pg_service_control start, stop, restart or check the server across systemd, launchd, Homebrew or service(8), local or over SSH.
For the hard cases there are guided skills — “Recover Broken MySQL” and “Recover Broken PostgreSQL” — that walk the whole runbook: read the error log, diagnose the fault, dump everything readable, rebuild into a fresh data directory, repair or recreate the damaged tables, and restart — always renaming the old data directory aside as a cold backup, never deleting it, and confirming before every destructive step. On a remote host, the fastest way in is the red Emergency button on the database's row in the server pane: it opens the assistant pre-loaded with the right recovery skill for that host.
5.11ORMs and app-native tooling: Drizzle and Convex
Finally, two tools meet your application where it defines its schema. The Drizzle ORM pane detects a Drizzle project (its tables, migrations and backend dialect) and runs drizzle-kit tasks for you — Generate SQL from your schema, Migrate, Push the schema directly, Pull (introspect) an existing database, and open Drizzle Studio to browse data. The Convex pane manages Convex, a reactive backend with a built-in database: run npx convex dev to watch and push functions, or stand up a self-hosted backend in Docker. Both need Node.js, which the panes will install via Homebrew if it is missing. These cover the application's own data layer; the dumps and backups above still protect whatever they write underneath.
Chapter 6
The Service Catalog
Every service FrontierStack can install, run and monitor — by category.
FrontierStack ships a catalog of 1626+ services across 113 categories. Every entry can be discovered, installed, started, configured and monitored from the app — and the AI Administrator can act on any of them. This chapter is the field guide: each category, what lives in it, and a one-line description of every service. Service descriptions are kept in English so they match the labels in the app.
Each service also has its own page on the website at frontierstack.app/services/ with ports, default web UI and the Homebrew formula.
6.1Overview
Local Health
built-in tool
Status Page
built-in tool
Alerts
built-in tool
Sites
built-in tool
Logs
built-in tool
Certificates
built-in tool
Tools
built-in tool
Scripts & Cron
built-in tool
Startup Items
built-in tool
Homebrew
built-in tool
Messaging Gateways
built-in tool
Notifications
built-in tool
Apple Services
built-in tool
Terminal Style
built-in tool
Setups
built-in tool
Paired Devices
built-in tool
Licences
built-in tool
Settings
built-in tool
6.2Setup & Migration
Migrate Setups
built-in tool
Apple Server Migration
built-in tool
Site Transfer
built-in tool
Install Wizard
built-in tool
6.3Locations & Places
Locations
built-in tool
Places
built-in tool
Device Discovery
built-in tool
Data Map
built-in tool
6.4Fleet & Remote
Remote Tools
built-in tool
Fleet Run
built-in tool
Remote KVM
built-in tool
GL.iNet KVM
built-in tool
Git Server
built-in tool
Remote Control & Lock
built-in tool
Server Clone
built-in tool
Headless Setup
built-in tool
Print Production
built-in tool
Screens
Polished VNC client for Mac & iOS (Edovia)
Cockpit
Browser console for Linux servers and Raspberry Pi (port 9090, web UI)
Windows Admin Center
Browser-based management for Windows Server fleets (port 443, web UI)
PiKVM
Open-source KVM-over-IP (Raspberry Pi) (port 443, web UI)
JetKVM
Compact, low-cost KVM-over-IP device (port 80, web UI)
TinyPilot
KVM-over-IP appliance (web UI) (port 443, web UI)
NanoKVM
Sipeed open KVM-over-IP (RISC-V) (port 80, web UI)
GL.iNet Comet (GL-RM1)
Compact KVM-over-IP with a browser console (port 80, web UI)
GL.iNet Comet Pro (GL-RM10)
KVM-over-IP with a built-in smart power plug (port 80, web UI)
Raritan Dominion KX
Enterprise KVM-over-IP switch (web UI) (port 443, web UI)
ATEN KVM over IP
KVM-over-IP switches & dongles (web UI) (port 443, web UI)
Jump Desktop
Fast, secure remote desktop (RDP/VNC/Fluid)
RustDesk
Open-source remote desktop with optional self-host relay (port 21115, web UI)
MeshCentral
Self-hosted web RMM and remote control (port 443, web UI)
Apache Guacamole
Clientless RDP, VNC and SSH gateway (port 8080, web UI)
Windows Remote Desktop
RDP access to Windows machines (port 3389)
WinRM / PowerShell Remoting
Remote command channel for Windows servers (port 5986)
Tactical RMM
Open-source RMM for Windows-focused fleets (port 443, web UI)
AnyDesk
Cross-platform remote desktop
ServerBuddy
Native Mac console for Linux servers
ITmanager.net
Mobile and desktop server administration service (web UI)
CloudRay
Hosted Bash automation, scheduling and fleet execution (web UI)
CtrlOps
Local-first AI, SSH and Linux server management
Level RMM
Browser RMM with peer-to-peer remote access (web UI)
6.5Networking
Traffic
built-in tool
Router & Network
built-in tool
Power over Ethernet
built-in tool
UniFi
built-in tool
SFTP
built-in tool
WebDAV
built-in tool
Time Capsule
built-in tool
Internet Health
built-in tool
Service Scan
built-in tool
Wi-Fi Analyser
built-in tool
BIND 9 (named)
Authoritative/recursive DNS server (port 53)
netboot.xyz
Network-boot OS installers via PXE/iPXE (port 3000, web UI)
mosh
Roaming, lag-tolerant remote shell (SSH bootstrap + UDP)
SSH3
SSH over QUIC/HTTP3 — faster handshakes, hidden behind a secret URL
Zeroconf / Bonjour
Zero-configuration service discovery (mDNS/DNS-SD) (port 5353)
6.6VPN
VPN
built-in tool
ZeroTier Controller
built-in tool
Tailnet
built-in tool
ZeroTier
Zero Trust SD-WAN / virtual networks — agent + API
NetBird
Open-source Zero Trust networking (self-hostable)
Twingate
Zero Trust remote access (VPN replacement)
CloudConnexa
OpenVPN's cloud-delivered VPN / ZTNA (formerly OpenVPN Cloud) (web UI)
Netmaker
Fast WireGuard mesh networks (self-hosted)
WireGuard
Modern, fast VPN — host your own, or the mesh base layer (port 51820)
OpenVPN
The classic open-source SSL/TLS VPN (port 1194)
Intego Privacy Protection (VPN)
Intego's commercial VPN — a Private Internet Access-based client for Mac
Proton VPN
Privacy VPN (WireGuard/OpenVPN, Secure Core, kill switch)
Headscale
Self-hosted Tailscale control server (open-source) (port 8080, brew: headscale)
Nebula
Lightweight overlay mesh (Slack/Defined Networking)
OpenZiti
Zero-trust overlay fabric with SDKs (self-hosted)
Firezone
WireGuard-based zero-trust access gateway
tinc
Classic self-routing mesh VPN (open-source)
n2n
Peer-to-peer layer-2 VPN over a supernode (ntop)
innernet
WireGuard mesh with CIDR-based access (tonari)
strongSwan
IKEv2/IPsec VPN server (port 500)
wg-easy
WireGuard VPN with a simple web UI (port 51821, web UI)
TP-Link LightLink VPN
TP-Link remote-access VPN — managed via the Navi Desktop app
Tailscale
WireGuard mesh VPN (brew: tailscale)
Tunnelblick
Free OpenVPN client for macOS
6.7Routers & Firewalls
macOS Firewall
built-in tool
OPNsense
Open-source firewall/router OS (REST API) (port 443, web UI)
pfSense
FreeBSD firewall/router OS (REST via package) (port 443, web UI)
PoE Switch (RFC 3621)
Managed PoE switch — port power, budget & cycling over SNMP (port 161, web UI)
MikroTik (RouterOS)
RouterOS devices — REST API (v7+) (port 443, web UI)
UniFi
Ubiquiti Cloud Gateway / Dream Machine + Network controller (port 443, web UI)
UniFi OS Server
Self-hosted UniFi OS — run the full stack on your own Mac or Linux box (port 11443, web UI)
Peplink
SD-WAN routers with multi-WAN failover/bonding (port 443, web UI)
Cradlepoint
Cellular/5G edge routers (NCOS + NetCloud) (port 443, web UI)
OpenWrt
Open-source router firmware (LuCI / ubus) (port 80, web UI)
Firewalla
Home/SMB security router (cloud MSP API)
IPFire
Hardened open-source Linux firewall (web UI) (port 444, web UI)
VyOS
Linux network OS — unified CLI + HTTPS API (port 443, web UI)
Untangle / Arista NG Firewall
Debian network gateway — web admin (commercial) (port 443, web UI)
Sophos Firewall
Next-gen firewall appliance — web UI + API (commercial) (port 4444, web UI)
FortiGate
Fortinet next-gen firewall — REST API (commercial) (port 443, web UI)
Palo Alto Networks
PAN-OS next-gen firewall — XML/REST API (commercial) (port 443, web UI)
Cisco Secure Firewall
Cisco NGFW (Firepower/ASA) — FMC/FDM API (commercial) (port 443, web UI)
WatchGuard Firebox
Fireware firewall appliance — web UI + Cloud API (commercial) (port 8080, web UI)
UFW (Uncomplicated Firewall)
Easy iptables/nftables host firewall for Linux servers (manage over SSH)
6.8Web Servers
Apache
built-in tool
Nginx
built-in tool
Vercel
built-in tool
Railway
built-in tool
Vite
built-in tool
Localhost
built-in tool
Caddy
Automatic-HTTPS web server / reverse proxy (port 80, brew: caddy)
Laravel Herd
One-click PHP dev environment (Mac app) (port 80)
Apache Tomcat
Java servlet/JSP application server (port 8080, web UI, brew: tomcat)
Puma
Threaded Rack/HTTP server — the default app server for Rails (port 3000)
Microsoft IIS
Windows web server and application platform (port 80, web UI)
OpenLiteSpeed
High-performance web server with web admin UI (port 7080, web UI)
Angular CLI
Scaffold, serve & build Angular apps (port 4200, web UI)
6.9DNS
Dynamic DNS
built-in tool
DNS
built-in tool
Domain Registrars
built-in tool
AdGuard Home
Network-wide ad/tracker-blocking DNS (self-hosted) (port 3000, web UI)
Pi-hole
Network-wide ad/tracker-blocking DNS sinkhole (port 80, web UI)
Nebula Sync
Sync configuration across Pi-hole instances
Kea DHCP
ISC's modern DHCPv4/DHCPv6 server (REST + DB back-ends) (port 8000)
ISC DHCP
Classic ISC dhcpd (EOL — migrate to Kea)
Dnsmasq
Lightweight DNS forwarder + DHCP + TFTP (port 53, brew: dnsmasq)
udhcpd (BusyBox)
Tiny DHCP server (BusyBox / embedded)
DNSimple
Managed DNS + domain registrar — live zone/record management (web UI)
Infoblox NIOS (DDI)
Enterprise DNS / DHCP / IPAM appliance (DDI) (port 443, web UI)
Windows Server DHCP
DHCP Server role on Windows Server
6.10Runtimes
Runtime Health
built-in tool
PHP
built-in tool
Python
built-in tool
Node.js
built-in tool
React
built-in tool
Java
built-in tool
Go
built-in tool
Rust
built-in tool
Ruby
built-in tool
Perl
built-in tool
.NET
built-in tool
Supabase Edge Functions
Deno serverless functions on the edge (port 54321)
code-server
VS Code in the browser (self-hosted) (port 8080, web UI, brew: code-server)
Next.js
React framework served by a Node process (SSR/SSG) (port 3000)
SvelteKit (Svelte)
Svelte app framework served by a Node process (SSR/SSG) (port 3000)
Nuxt (Vue)
Vue framework served by a Node process (SSR/SSG) (port 3000)
Astro
Content-first framework — zero JS by default; popular headless-WordPress front end (port 4321)
Solid (SolidJS)
Fine-grained reactive UI framework — SolidStart serves it as a Node process (port 3000)
Tailwind CSS
Utility-first CSS — standalone build CLI (no Node)
.NET (ASP.NET Core)
Run ASP.NET Core & Blazor apps (Kestrel) (port 5000)
Wasmtime
Bytecode Alliance WebAssembly runtime (WASI)
Wasmer
WebAssembly runtime with a package registry
WasmEdge
Lightweight WASM runtime for cloud/edge & AI (CNCF)
wasmCloud
Distributed WebAssembly platform (CNCF) (port 4222, web UI)
Fermyon Spin
Serverless WebAssembly apps & HTTP microservices (port 3000)
6.11Databases
Database Health
built-in tool
MySQL
built-in tool
MySQL Clusters
built-in tool
Postgres
built-in tool
Database Ops
built-in tool
Cloud SQL
built-in tool
Drizzle ORM
built-in tool
Prisma
built-in tool
Airtable
built-in tool
Convex
built-in tool
Supabase
built-in tool
MongoDB
Document (NoSQL) database (port 27017, brew: mongodb-community)
Microsoft SQL Server
Microsoft relational database for Windows and Linux (port 1433)
Oracle Database
Enterprise relational database (port 1521, web UI)
CockroachDB
Distributed SQL database (port 26257, web UI)
Apache Cassandra
Distributed wide-column database (port 9042, brew: cassandra)
ScyllaDB
High-performance Cassandra-compatible database (port 9042)
Neo4j
Graph database with Cypher query language (port 7474, web UI, brew: neo4j)
Apache CouchDB
Document database with HTTP API and sync (port 5984, web UI, brew: couchdb)
Couchbase Server
Distributed document, key-value and search database (port 8091, web UI)
PlanetScale
Hosted MySQL with database branching (cloud API) (port 3306)
Neon
Serverless Postgres — autoscaling & branching (cloud API) (port 5432)
Turso
Distributed SQLite (libSQL) at the edge (cloud API) (port 8080)
PostgREST
Instant REST API over a PostgreSQL database (port 3000)
PocketBase
Open-source backend in one file (SQLite + auth + realtime) (port 8090, web UI)
Firebase
Google's backend-as-a-service — Firestore, Auth, Storage, Functions (cloud) (port 4000, web UI)
Patroni
HA PostgreSQL — automatic failover (port 8008, web UI)
6.12Vector Databases
Vector Databases
built-in tool
Qdrant
Fast vector DB for embeddings & RAG (self-hosted) (port 6333, web UI)
Chroma
Developer-friendly embedding database (self-hosted) (port 8000)
Weaviate
Vector DB with built-in vectorizers & hybrid search (self-hosted) (port 8080)
Milvus
Scalable, distributed vector database (self-hosted) (port 19530)
pgvector
Vector search inside PostgreSQL (extension) (port 5432)
FAISS
Fast in-process vector similarity search (library)
6.13Analytics Databases
InfluxDB
Time-series database for metrics and IoT (port 8086, web UI, brew: influxdb)
DuckDB
In-process OLAP database — the SQLite of analytics
ClickHouse
Columnar OLAP database for fast analytics (port 8123)
Apache Druid
Real-time analytics database (OLAP) (port 8888, web UI)
TimescaleDB
Time-series database (PostgreSQL extension) (port 5432)
6.14Data Pipelines & ETL
Airbyte
Open-source ELT with 300+ connectors (self-hosted / cloud) (port 8000, web UI)
Meltano
Open-source ELT built on Singer taps & targets (CLI) (port 5000, web UI)
dbt
SQL-based data transformation & modeling (self-hosted / cloud) (port 8080, web UI)
Dagster
Asset-oriented data orchestrator (self-hosted / cloud) (port 3000, web UI)
Prefect
Modern Python workflow orchestration (self-hosted / cloud) (port 4200, web UI)
Kestra
Event-driven orchestration & scheduling, YAML flows (self-hosted) (port 8080, web UI)
Redpanda Connect (Benthos)
Declarative stream-processing & connectors (self-hosted CLI) (port 4195)
NATS JetStream Pipelines
Persistent streams & consumers for event pipelines (self-hosted) (port 8222, brew: nats-server)
6.15Caching
Redis
In-memory key-value store (port 6379, brew: redis)
Memcached
Distributed memory cache (port 11211, brew: memcached)
6.16Search
Elasticsearch
Search & analytics engine (Elastic) (port 9200, web UI, brew: elasticsearch-full)
Meilisearch
Fast, typo-tolerant search engine (port 7700, web UI, brew: meilisearch)
OpenSearch
Search & analytics engine (port 9200, web UI, brew: opensearch)
Photon
Self-hosted OpenStreetMap geocoder (search-as-you-type) (port 2322)
6.17Backup
Backups
built-in tool
Time Machine
built-in tool
Carbon Copy Cloner
built-in tool
Synology Active Backup for Business
Centralized backup for PCs, servers, VMs & SaaS (Synology) (port 5001, web UI)
Databasus
Self-hosted database backup & point-in-time recovery (web UI)
Restic
Fast, encrypted, deduplicated backups
rclone
Sync & mount 70+ cloud storages
Dropbox (Backup Target)
Use Dropbox as an encrypted off-site backup destination (restic / rclone)
Veeam Backup & Replication
Enterprise VM, server and cloud backup (port 9392, web UI)
BorgBackup
Deduplicating encrypted backups over SSH
Kopia
Encrypted snapshots to cloud or local storage (port 51515, web UI)
Duplicati
Web UI backups to cloud storage (port 8200, web UI)
6.18Storage & NAS
iCloud+
built-in tool
Xsan
built-in tool
Supabase Storage
S3-compatible object storage from Supabase (port 54321, web UI)
Nextcloud
Files, sync, office & app platform (port 80, web UI)
Syncthing
Peer-to-peer continuous file sync (port 8384, web UI, brew: syncthing)
TrueNAS
ZFS NAS OS — pools, snapshots, replication (self-hosted) (port 443, web UI)
ZimaOS / CasaOS
Personal-cloud NAS OS for ZimaCube / ZimaBoard (self-hosted) (port 80, web UI)
Synology DSM
Synology NAS appliance (DSM) (port 5001, web UI)
QNAP QTS
QNAP NAS appliance (QTS/QuTS hero) (port 8080, web UI)
UGREEN NAS
UGREEN NASync / UGOS Pro appliance health, storage, containers, services and logs through a linked remote helper (port 443, web UI)
Ceph
Distributed object/block/file storage cluster (self-hosted) (port 8443, web UI)
GlusterFS
Scale-out network filesystem (self-hosted)
iSCSI (SAN)
Block storage over TCP/IP — initiator & target (port 3260) (port 3260)
NVMe / NVMe-oF
NVMe SSDs & NVMe-over-Fabrics targets (TCP/RDMA/FC) (port 4420)
Fibre Channel (SAN)
FC SAN fabric — HBA ports, WWNs, multipath
RDMA / RoCE / iWARP
Remote Direct Memory Access fabrics — RoCE & iWARP
InfiniBand Fabric
InfiniBand HCA/fabric — ports, SM, port-error counters
NVIDIA NVLink
GPU-to-GPU interconnect — per-link state & bandwidth
NVIDIA NVSwitch
NVLink switch fabric — Fabric Manager service
Liqid (Composable)
Composable PCIe/CXL fabric — pool & attach GPUs/NVMe (web UI)
GigaIO FabreX
PCIe/CXL memory fabric — composable GPU pooling (web UI)
WEKA
Parallel filesystem for AI/HPC (GPUDirect) (port 14000, web UI)
ownCloud
Self-hosted file sync & share (port 80, web UI)
Seafile
File sync & share with client-side encryption (self-hosted) (port 8000, web UI)
Resilio Sync
P2P file sync (BitTorrent-based) (port 8888, web UI)
Dropbox
Cloud file sync & share (app + API) (web UI)
Samba
SMB file sharing (+ Time Machine) (port 445, brew: samba)
Netatalk
AFP file sharing for legacy Macs and Xserve estates (port 548)
File Browser
Web file manager for a directory (port 8080, web UI)
Filestash
Web file manager for S3/SFTP/FTP/WebDAV/… (port 8334, web UI)
Unraid
NAS/server OS — storage array, VMs & Docker (port 80, web UI)
Box
Secure content, collaboration and governed agent workflows (SaaS) (web UI)
6.19Object Storage & S3-Compatible
MinIO
S3-compatible object storage (port 9000, web UI, brew: minio)
SeaweedFS
Fast distributed object/file store (self-hosted) (port 8888, web UI)
Garage
Lightweight self-hosted S3 object store (Deuxfleurs) (port 3900)
Ceph RGW (RADOS Gateway)
S3/Swift object gateway on a Ceph cluster (self-hosted) (port 7480)
OpenStack Swift
Highly-available object store (OpenStack, self-hosted) (port 8080)
Cloudflare R2
S3-compatible object storage with zero egress fees (cloud) (web UI)
Backblaze B2
Low-cost cloud object storage, S3-compatible (cloud) (web UI)
Wasabi
Hot cloud object storage, S3-compatible, no egress fees (cloud) (web UI)
RustFS
High-performance S3-compatible object storage (Rust) (port 9000, web UI)
6.20Mail
Mail Server
built-in tool
Message Delivery
built-in tool
Proton
Encrypted mail, VPN, drive & passwords (cloud) (port 1025, web UI)
HEY
37signals hosted email & calendar (Imbox, Screener, Paper Trail) (web UI)
Rspamd
Fast spam-filtering system (self-hosted) (port 11334, web UI)
Apache SpamAssassin
Rule-based spam classifier (self-hosted) (port 783)
MailScanner
Email security framework / gateway (self-hosted)
Proxmox Mail Gateway
Anti-spam/AV email gateway appliance (self-hosted) (port 8006, web UI)
mailcow
Dockerized full mail-server suite (self-hosted) (port 443, web UI)
Modoboa
Mail hosting & management platform (self-hosted) (port 443, web UI)
OpenDKIM
DKIM signing & verification milter (self-hosted) (port 8891)
OpenDMARC
DMARC policy filter & reporting (self-hosted) (port 8893)
Postfix
SMTP mail transfer agent (port 25)
Dovecot
IMAP/POP3 mail delivery server (port 143)
Stalwart Mail Server
All-in-one secure mail server (SMTP/IMAP/JMAP) (port 8080, web UI)
Maddy Mail Server
Composable single-binary mail server (SMTP/IMAP)
Inbox Zero
Open-source AI email assistant (self-hosted) (port 3000, web UI)
6.21Mailing Lists
Mailing Lists
built-in tool
Mailchimp
Hosted email marketing & audiences (cloud) (web UI)
Brevo
Email/SMS marketing + transactional (cloud) (web UI)
MailerLite
Simple newsletter & subscriber lists (cloud) (web UI)
Klaviyo
E-commerce email/SMS & segmentation (cloud) (web UI)
Campaign Monitor
Designer-friendly email campaigns (cloud) (web UI)
Mailgun
Developer transactional email + lists (cloud) (web UI)
SendGrid
Twilio's email API & marketing lists (cloud) (web UI)
Amazon SES
AWS low-cost bulk/transactional email (cloud) (web UI)
Postmark
Fast, reliable transactional email (cloud) (web UI)
Resend
Developer-first transactional email API (cloud) (web UI)
MailPace
Fast, privacy-friendly transactional email (cloud) (web UI)
Nylas
Email/calendar/contacts API platform (cloud) (web UI)
Listmonk
Self-hosted high-performance newsletter manager (port 9000, web UI)
Mautic
Self-hosted marketing automation (port 80, web UI)
Mailtrain
Self-hosted Node.js newsletter app (port 3000, web UI)
Postal
Self-hosted full mail/delivery platform (port 5000, web UI)
6.22Email Deliverability & Reputation
Email Delivery
built-in tool
DMARC Aggregate Reporting
Collect & parse DMARC RUA reports (self-hosted: parsedmarc)
BIMI
Brand logo in the inbox via DNS + VMC (standard)
MTA-STS & TLS-RPT
Enforce SMTP TLS and get TLS failure reports (standard)
GlockApps
Inbox-placement & spam-filter testing (cloud) (web UI)
MXToolbox
DNS, blacklist & email health lookups (cloud) (web UI)
Google Postmaster Tools
Gmail sender reputation & spam-rate data (cloud) (web UI)
Mailhardener
All-in-one email-security monitoring & reporting (cloud) (web UI)
EasyDMARC
DMARC management & deliverability platform (cloud) (web UI)
dmarcian
DMARC reporting & deployment platform (cloud) (web UI)
6.23Message Queues & Streaming
Queue Operations
built-in tool
Supabase Realtime
Postgres change streams over WebSockets (port 54321, web UI)
NATS
High-performance messaging + JetStream (self-hosted) (port 4222, brew: nats-server)
Apache Kafka
Distributed event streaming (self-hosted) (port 9092, brew: kafka)
AKHQ
Web administration and observability console for Kafka (port 8080, web UI)
Apache ZooKeeper
Distributed coordination, quorum and leader election (port 2181, brew: zookeeper)
Redpanda
Kafka-compatible streaming, no JVM/ZooKeeper (port 9092)
Apache Pulsar
Distributed pub-sub & queuing with tiered storage (port 6650)
Apache RocketMQ
Low-latency distributed messaging (ordered, transactional) (port 10911)
Redis Streams
Lightweight log/stream with consumer groups (Redis) (port 6379, brew: redis)
Celery
Distributed task queue for Python (workers + broker) (web UI)
RabbitMQ
AMQP message broker with queue monitoring and optional MQTT (port 5672, web UI, brew: rabbitmq)
6.24Push Services
APNs
built-in tool
ntfy
Self-hostable pub-sub push (HTTP) (port 80, web UI, brew: ntfy)
Gotify
Self-hosted push server + Android app (port 80, web UI)
OneSignal
Hosted multi-channel push (cloud) (web UI)
Firebase (FCM)
Google's cross-platform push (cloud) (web UI)
Airship
Enterprise customer-engagement push (cloud) (web UI)
Matrix Notifications
Push via the Matrix chat protocol (web UI)
Synapse
Self-hosted Matrix homeserver (port 8008, brew: matrix-synapse)
Element
Flagship Matrix chat client
UnifiedPush
Open push standard (Google-free) (web UI)
PushDeer
Open-source, no-app-fuss push (web UI)
Pushover
Simple paid push to iOS/Android/desktop (web UI)
Apprise
One CLI/library → 80+ push services
6.25Chat & Collaboration
Discord
Community chat & voice (cloud) (web UI)
Slack
Team chat & workflows (cloud) (web UI)
Buzz
Group chat for humans + AI agents (Block; cloud or self-hosted) (web UI)
Matrix (Synapse + Element)
Open, federated chat — self-hosted (Docker) (port 8008, web UI)
Mattermost
Open-source Slack alternative (self-hosted) (port 8065, web UI)
Rocket.Chat
Open-source team chat platform (self-hosted) (port 3000, web UI)
Zulip
Threaded team chat (self-hosted or cloud) (port 80, web UI)
Ergo (IRCd)
Modern single-binary IRC server (IRCv3, built-in services) (port 6667)
InspIRCd
Modular C++ IRC server (self-hosted) (port 6667)
UnrealIRCd
Popular full-featured IRC server (self-hosted) (port 6667)
Solanum (IRCd)
The IRCd that runs Libera.Chat (charybdis fork) (port 6667)
ZNC (IRC bouncer)
IRC bouncer — stay connected, replay history (port 6697, web UI)
The Lounge
Self-hosted web IRC client (always-on) (port 9000, web UI)
KiwiIRC
Web IRC client + gateway (self-hosted) (port 7778, web UI)
Atheme (IRC services)
NickServ/ChanServ services for TS6 IRCds
Anope (IRC services)
IRC services (NickServ/ChanServ) for many IRCds
Libera.Chat
Public IRC network (FOSS communities) — connect, not self-host (port 6697)
Open OSCAR Server
Self-hostable AIM/ICQ (OSCAR) server — run your own AIM (port 5190)
AIM OSCAR Server
Alternative OSCAR server — make your own AIM chat network (port 5190)
Telegram
Cloud messaging with a powerful Bot API (cloud) (web UI)
TeamSpeak
Low-latency voice server (self-hosted) (port 9987)
Mumble
Open-source low-latency voice (self-hosted) (port 64738)
Jitsi Meet
Open-source video conferencing (self-hosted) (port 8443, web UI)
SimpleX Chat
Private messenger with no user IDs (self-hostable relays)
Session
Onion-routed private messenger (no phone number)
Prosody
Lightweight XMPP (Messages) server (port 5222, brew: prosody)
6.26SMS & iMessage Gateways
Gammu (gammu-smsd)
Send/receive SMS via a GSM modem (self-hosted)
Kannel
Open-source SMS/WAP gateway (self-hosted) (port 13013)
ModemManager
Linux modem daemon — SMS via mmcli (self-hosted)
SMS Gateway for Android
Turn an Android phone into an SMS HTTP API (self-hosted) (web UI)
SMSSync
Android SMS↔webhook relay (self-hosted)
Android + Tasker
DIY SMS gateway via Tasker automation (self-hosted)
Home Assistant SMS
SMS notify/receive in Home Assistant (Gammu)
AirMessage
Self-hosted iMessage bridge — server on this Mac (port 1359)
BlueBubbles
Self-hosted iMessage bridge — server on this Mac (web UI)
6.27Business Messaging
KakaoTalk AlimTalk
Kakao business notification templates — Korea (cloud) (web UI)
LINE Official Account
Customer messaging & loyalty on LINE (web UI)
WhatsApp Business Platform
WhatsApp business messaging — templates, catalogues (live) (web UI)
WeChat Official Account
WeChat business account — China (broadcasts, menus, mini-programs) (web UI)
Zalo Official Account
Zalo business account — Vietnam (broadcasts & chat) (web UI)
KakaoTalk Channel
Kakao business channel — Korea (friend broadcasts & chat) (web UI)
Viber Business Messages
Branded business messages on Viber (web UI)
Facebook Messenger
Messenger business messaging (Meta) (web UI)
Instagram Messaging
Instagram DM API for business (Meta) (web UI)
Apple Messages for Business
Store↔customer chat inside iMessage (web UI)
RCS Business Messaging
Branded rich business messaging (SMS successor) (web UI)
Attentive
SMS & email marketing for retail/DTC (web UI)
Postscript
SMS marketing for Shopify stores (web UI)
Omnisend
Email & SMS marketing automation (e-commerce) (web UI)
SimpleTexting
Business SMS/MMS marketing & two-way texting (web UI)
ManyChat
Chat marketing bots — Instagram/Messenger/WhatsApp (live) (web UI)
Respond.io
Omnichannel customer-conversation inbox (web UI)
Gupshup
Conversational messaging API (WhatsApp & more) (web UI)
WATI
WhatsApp Business team inbox & broadcasts (web UI)
Charles
Conversational commerce on WhatsApp (web UI)
Trengo
Multichannel team inbox for customer chat (web UI)
Intercom
Customer messaging & proactive marketing (live) (web UI)
Gorgias
E-commerce helpdesk with chat & proactive messages (web UI)
6.28Calendars
Calendar Discovery
built-in tool
Calendar Health
built-in tool
Event Server Monitoring
built-in tool
ICS Feeds
built-in tool
Radicale
Lightweight CalDAV/CardDAV server (port 5232, web UI)
Baïkal
PHP CalDAV/CardDAV server (SabreDAV) (port 80, web UI)
Nextcloud Calendar
Calendar app on a Nextcloud server (web UI)
DAViCal
PHP/PostgreSQL CalDAV server (port 80, web UI)
SOGo
Groupware (CalDAV/CardDAV/ActiveSync) (port 20000, web UI)
Apple Calendar Server
Migrate the old macOS Server CalDAV (port 8443)
Google Calendar
Hosted calendar (CalDAV / API) (web UI)
Outlook Calendar
Microsoft 365 calendar (Graph API) (web UI)
Calendly
Hosted scheduling / booking links (web UI)
Cal.com
Open-source scheduling (self-hostable) (web UI)
6.29Identity & Accounts
Accounts
built-in tool
Open Directory
Apple's built-in LDAP / Kerberos directory (port 389)
Dropbox Business
Team management & audit-log APIs for Dropbox Business (cloud) (web UI)
Keycloak
Open-source identity & access management (SSO) (port 8080, web UI)
FreeIPA
Open-source identity management (LDAP/Kerberos, self-hosted) (port 443, web UI)
Authentik
Self-hosted identity provider (Docker) (port 9000, web UI)
Okta
Workforce identity & SSO — live API health (web UI)
Microsoft Entra ID
Azure AD — cloud identity & SSO (Graph health) (web UI)
Google Workspace
Google's identity & productivity suite (Admin SDK) (web UI)
AD FS
Active Directory Federation Services (on-prem SSO)
Authenticate.com
Identity verification & KYC API (cloud) (web UI)
Univention Corporate Server
Open IAM, SSO, directory and application platform (port 443, web UI)
6.30Customer Identity
WorkOS
B2B auth — SSO, Directory Sync, AuthKit (live) (web UI)
Auth0
Hosted authentication platform (Okta) (web UI)
Clerk
Hosted auth & user management for web apps (cloud) (web UI)
Supabase Auth
Auth from the Supabase stack (cloud or local) (port 54321, web UI)
Better Auth
Framework-agnostic auth library for TypeScript apps
FusionAuth
Self-hostable CIAM / auth server (OAuth2/OIDC/SAML) (port 9011, web UI)
Ory Kratos
Headless identity & user management (self-hosted) (port 4433)
Ory Hydra
OAuth2 & OpenID Connect provider (self-hosted) (port 4444)
Zitadel
Self-hostable identity platform (OIDC/SAML, multi-tenant) (port 8080, web UI)
Authelia
SSO + 2FA auth gateway for your services (port 9091, web UI)
6.31Decentralized Identity
Hyperledger Aries (ACA-Py)
Issue/verify Verifiable Credentials over DIDComm (self-hosted)
walt.id
Open-source SSI stack — issuer, verifier & identity wallet (web UI)
Veramo
JS/TS framework for DIDs & Verifiable Credentials
6.32Version Control
Git
built-in tool
Gitea
Lightweight self-hosted Git service (port 3000, web UI, brew: gitea)
Forgejo
Community fork of Gitea (Codeberg) (port 3000, web UI, brew: forgejo)
GitHub
Live account, repository, PR/review/issue, notification, API quota and recent release-asset download dashboard (cloud) (web UI)
Cursor Origin (Early Beta)
Cursor's Git forge — live repositories and pull requests (cloud, Early Beta) (web UI)
GitLab
Full DevOps platform — GitLab.com, Dedicated or self-managed (Linux, Docker, Kubernetes, GET) (port 443, web UI)
GitHub Enterprise
Self-hosted / managed GitHub for organizations (port 443, web UI)
Bitbucket
Atlassian Git hosting — Cloud or self-hosted (Data Center) (port 443, web UI)
Codeberg
Free community Git hosting (Forgejo, nonprofit) (port 443, web UI)
SourceHut
Lightweight, email-driven Git suite (cloud or self-hosted) (port 443, web UI)
AWS CodeCommit
Managed private Git repositories on AWS (API) (port 443, web UI)
Pierre
Fast code review & collaboration on Git (cloud) (web UI)
Graphite
Stacked-PR code review on top of GitHub (cloud + CLI) (web UI)
Phabricator / Phorge
Self-hosted code review & repos (now maintained as Phorge) (port 443, web UI)
SourceForge
Open-source project hosting & downloads (cloud) (port 443, web UI)
Google Code (archive)
Defunct — read-only archive for migrating old projects (web UI)
Subversion (SVN)
Apache Subversion — centralized version control (self-hosted) (port 3690)
Jujutsu (jj)
Git-compatible VCS with a simpler, more powerful model
gh-dash
Terminal dashboard for GitHub PRs & issues (gh extension)
code.storage
Code hosting / storage platform (cloud) — see code.storage (web UI)
Entire
Code collaboration platform (cloud) — see entire.io (web UI)
Gitea Actions Runner
CI runner for Gitea/Forgejo Actions
Webhook (git-deploy)
Push-to-deploy via webhooks (port 9000, brew: webhook)
6.33CI/CD
Woodpecker CI
Lightweight container-native CI (port 8000, web UI)
GitHub Actions
CI/CD in GitHub — live build & deploy monitor (cloud) (web UI)
CodeRabbit
AI code reviewer for pull requests (cloud + CLI/IDE) (web UI)
GitLab CI/CD
Pipelines built into GitLab — GitLab.com, Dedicated or self-managed (web UI)
CircleCI
Cloud CI/CD with fast parallelism (cloud) (web UI)
Depot
Remote build acceleration — Docker & GitHub Actions runners (cloud) (web UI)
Bitbucket Pipelines
CI/CD built into Bitbucket Cloud (cloud) (web UI)
Travis CI
Hosted CI for open source & teams (cloud) (web UI)
Buildkite
Hybrid CI — your agents, their dashboard (cloud) (web UI)
Jenkins
The classic self-hosted automation server (port 8080, web UI, brew: jenkins-lts)
Drone CI
Container-native CI server (self-hosted) (port 80, web UI)
Concourse
Pipeline-centric CI with reproducible builds (self-hosted) (port 8080, web UI)
TeamCity
JetBrains CI/CD server (self-hosted or cloud) (port 8111, web UI)
GoCD
Open-source CI/CD with value-stream pipelines (self-hosted) (port 8153, web UI)
Argo CD
GitOps continuous delivery for Kubernetes (self-hosted) (port 8080, web UI)
Flux CD
GitOps toolkit for Kubernetes (self-hosted)
Spinnaker
Multi-cloud continuous delivery (self-hosted) (port 9000, web UI)
Azure DevOps
Azure Pipelines, Repos, Boards & Artifacts (cloud) (web UI)
Buildkite Agent
Self-hosted runner for Buildkite pipelines
Jenkins Agent
Build node that connects to a Jenkins controller
GitHub Actions Runner
Self-hosted runner for GitHub Actions
Blacksmith
Managed high-performance CI runners for GitHub Actions (cloud) (web UI)
GitLab Runner
Self-hosted runner for GitLab CI/CD (works on this Mac) (brew: gitlab-runner)
6.34Build & Compile
Build & Render Farm
built-in tool
Workbox
Google's service-worker libraries for PWAs
Vite PWA Plugin
Zero-config PWA for Vite (vite-plugin-pwa)
Next.js PWA
PWA/service-worker support for Next.js
Nuxt PWA Module
PWA module for Nuxt (@vite-pwa/nuxt)
Xcode Build / Xcode Cloud
Apple's build system (xcodebuild) + Xcode Cloud CI
Bazel
Fast, scalable multi-language build system (Google)
Tuist
Xcode project generation & build optimization
Buck2
Meta's fast, hermetic multi-language build system
CMake
Cross-platform build-system generator (C/C++)
Ninja
Small, very fast build backend
Meson
Fast, user-friendly build system (Ninja backend)
Gradle
JVM/Android build automation with build cache
Apache Maven
Java build & dependency management
distcc
Distribute C/C++ compiles across machines
Icecream (icecc)
Distributed compiler with central scheduler
Bazel Remote Execution
Run Bazel actions on a remote farm (RBE)
BuildGrid
Open-source Remote Execution API server (self-hosted)
Incredibuild
Commercial distributed build acceleration
ccache
Compiler cache for C/C++ rebuilds
sccache
Shared compiler cache (C/C++/Rust) with cloud backends
Bazel Remote Cache
Shared HTTP/gRPC cache for Bazel (self-hosted) (port 8080)
Tuist Cache
Binary caching for Xcode builds (Tuist)
6.35Internal Developer Portals
Backstage
Spotify's open-source developer portal framework (self-hosted) (port 7007, web UI)
Port
No-code internal developer portal (cloud) (web UI)
Cortex
Service catalogue with scorecards & maturity (cloud) (web UI)
OpsLevel
Service maturity & ownership portal (cloud) (web UI)
Humanitec
Platform orchestrator for internal platforms (cloud + agent) (web UI)
Score
Open workload spec for portable deployments (CLI)
Roadie
Managed (hosted) Backstage (cloud) (web UI)
6.36Infrastructure as Code
Terraform
HashiCorp's declarative infrastructure as code (CLI)
OpenTofu
Open-source, community fork of Terraform (CLI)
Pulumi
Infrastructure as code in real languages (CLI / cloud)
Ansible
Agentless configuration management & automation (CLI)
Chef
Policy-as-code configuration management (Progress Chef)
Puppet
Declarative configuration management at scale (Perforce)
Salt
Event-driven remote execution & config management (CLI)
Packer
Build identical machine images for any platform (CLI)
AWS CloudFormation
Native AWS infrastructure as code (templates / CLI) (web UI)
AWS CDK
Define AWS infra in code, synth to CloudFormation (CLI)
AttuneOps
Reusable multi-step SSH and WinRM automation blueprints (web UI)
6.37API Testing & Synthetic Monitoring
Postman
API platform — build, test, mock & monitor (app / cloud) (web UI)
Bruno
Open-source, offline, git-friendly API client (app / CLI)
Insomnia
API client for REST, GraphQL & gRPC (app)
Grafana k6
Developer-centric load & performance testing (CLI)
Artillery
Load testing & smoke tests for APIs and services (CLI)
Checkly
Monitoring-as-code — API checks & browser synthetics (cloud + CLI) (web UI)
Changedetection.io
Website change detection & notifications (port 5000, web UI)
6.38Proxies & Load Balancers
Reverse Proxy
built-in tool
Debug Share
built-in tool
ProxySQL
High-performance MySQL proxy (port 6033, brew: proxysql)
MySQL Router
Routing for MySQL InnoDB Cluster (port 6446)
Nginx Proxy Manager
Web-UI reverse proxy (Docker) (port 81, web UI)
keepalived
VRRP virtual IP failover + LVS load balancing
6.39Proxy Gateways
HAProxy
TCP/HTTP load balancer & proxy (brew: haproxy)
Traefik
Container-native reverse proxy & LB (port 8080, web UI, brew: traefik)
Squid
Caching forward proxy (HTTP/HTTPS/FTP) (port 3128, brew: squid)
3proxy
Tiny multi-protocol proxy (HTTP/SOCKS) (port 3128)
Tinyproxy
Lightweight HTTP/HTTPS forward proxy (port 8888, brew: tinyproxy)
6.40CDN & Edge
Cloudflare
built-in tool
Akamai
Enterprise CDN, security & edge compute (cloud) (web UI)
Fastly
Real-time CDN with VCL/Compute edge (cloud) (web UI)
Imperva
WAF-first CDN & DDoS protection (cloud) (web UI)
Amazon CloudFront
AWS CDN tied to S3/EC2 origins (cloud) (web UI)
Google Cloud CDN
GCP CDN on global load balancing (cloud) (web UI)
Azure Front Door
Microsoft's global entry point: CDN + WAF + LB (cloud) (web UI)
6.41Hosting
here.now
built-in tool
Hostinger
built-in tool
DigitalOcean
built-in tool
Vultr
built-in tool
Linode (Akamai)
built-in tool
Hetzner
built-in tool
Sakura Cloud
built-in tool
ConoHa
built-in tool
Cloudways
built-in tool
SiteGround
built-in tool
WP Engine
built-in tool
Kinsta
built-in tool
Pressable
built-in tool
Contabo
built-in tool
Cloud Servers
built-in tool
Abacus SuperComputer
Always-on Ubuntu VM from Abacus.AI (2 vCPU / 8 GB, SSH + root) (web UI)
Fly.io
Deploy apps as microVMs on Fly's global edge (cloud CLI)
Coolify
Self-hosted PaaS (Heroku/Netlify/Vercel alt.) (port 8000, web UI)
Dokploy
Open-source deployment platform (PaaS) (port 3000, web UI)
CapRover
Self-hosted PaaS on Docker Swarm (port 3000, web UI)
Kamal
Deploy containers to your own servers over SSH (37signals)
Dokku
Minimal self-hosted PaaS (git push deploy)
V2 Cloud
Managed cloud desktops, servers and isolated AI workspaces (web UI)
Zenlayer
Edge cloud compute and global networking (web UI)
cPanel & WHM
Commercial web-hosting server control panel (port 2087, web UI)
6.42AWS Control
S3 Buckets
built-in tool
EC2 Instances
built-in tool
Lightsail
built-in tool
CloudFront/CDN
built-in tool
Route 53 DNS
built-in tool
RDS Databases
built-in tool
DynamoDB
built-in tool
CloudWatch Logs
built-in tool
SNS Topics
built-in tool
Billing Alerts
built-in tool
IAM Key Warnings
built-in tool
6.43AI / LLMs
AI Administrator
built-in tool
AI Models
built-in tool
Spend & Billing
built-in tool
Ollama
built-in tool
LM Studio
built-in tool
Skill Manager
built-in tool
Open WebUI
built-in tool
RAG Manager
built-in tool
Firecrawl
built-in tool
Crawl4AI
built-in tool
Apify
built-in tool
Playwright
built-in tool
Browserbase
built-in tool
Vane (Perplexica)
Self-hosted AI answer engine — the open-source Perplexity alternative (port 3000, web UI)
MLX
Apple-silicon model serving via MLX — CLI server or the oMLX menu-bar app (port 8080)
TurboFieldfare
Gemma 4 26B-A4B on Apple Silicon in ~2 GB of RAM (port 8080)
Cerebras
Very fast hosted inference on wafer-scale hardware (web UI)
MLX (Apple)
Apple's ML framework for Apple Silicon
vLLM
High-throughput LLM inference server (OpenAI-compatible) (port 8000)
llama.cpp Server
Lightweight local LLM server (OpenAI-compatible) (port 8080)
Mojo (Modular MAX)
Modular's AI language + MAX inference server (OpenAI-compatible) (port 8000)
LocalAI
Self-hosted, OpenAI-compatible inference server (port 8080, web UI)
Jan
Private, offline AI desktop app (OpenAI-compatible) (port 1337)
PrivateGPT
Ask questions of your documents, 100% offline (RAG) (port 8001, web UI)
IBM watsonx.ai
IBM's enterprise AI platform — Granite + third-party models (cloud/on-prem) (web UI)
Mem0
Memory layer for AI agents — self-hosted (Docker) or cloud (port 8888, web UI)
CrewAI (open source)
Multi-agent crews — Python framework + CLI (local)
Open Computer
Virtual OS for AI agents — QEMU VM per agent (Mintplex Labs) (web UI)
LiteLLM
Proxy/gateway for 100+ LLM APIs (OpenAI-compatible) (port 4000, web UI)
Tetrate Agent Router
Hosted LLM router — one OpenAI-compatible API (cloud) (web UI)
AnythingLLM
All-in-one self-hosted RAG chat app (port 3001, web UI)
Hugging Face
Model hub, Inference API & local tooling (web UI)
ChatLLM Teams
Abacus.AI's multi-model team chat & agent workspace (cloud) (web UI)
LibreChat
Self-hosted multi-provider AI chat UI (port 3080, web UI)
NotebookLM
Google's source-grounded research notebook (cloud) (web UI)
Open Notebook
Open-source, self-hosted NotebookLM alternative (port 8502, web UI)
OpenCode
Open-source AI coding agent (terminal)
Dyad
Local open-source AI app builder (desktop)
6.44AI Clusters
Exo Cluster
built-in tool
GPU Fabric
built-in tool
Petals
BitTorrent-style distributed inference of big models
Distributed Llama
Tensor-parallel Llama across cheap nodes (root + workers) (port 9998)
Slurm
HPC workload manager / job scheduler (port 6817)
Ray
Distributed compute for AI (training/serving/tuning) (port 8265, web UI)
Apache Spark
Distributed big-data processing engine (port 8080, web UI)
Dask
Parallel computing for Python (scales pandas/NumPy) (port 8787, web UI)
JupyterLab
Interactive notebooks for data & AI (Python) (port 8888, web UI)
Run:ai
GPU orchestration & fractional GPUs on Kubernetes (NVIDIA) (web UI)
NVIDIA Base Command Manager
GPU/HPC cluster provisioning & management (ex-Bright) (port 8081, web UI)
6.45Agent Platforms
Agent Operations
built-in tool
Runtimes
built-in tool
Activity
built-in tool
Routing & Integrations
built-in tool
Work
built-in tool
OpenClaw
built-in tool
Hermes
built-in tool
Odysseus
built-in tool
DeerFlow
built-in tool
CoWork OS
built-in tool
OpenAI Codex Runtime
built-in tool
Amp
built-in tool
DeepSeek Harness (Alpha)
built-in tool
Claude Code CLI
built-in tool
Gemini CLI
built-in tool
Factory Droid
built-in tool
OpenCode
built-in tool
Goose
built-in tool
LangGraph Platform
built-in tool
CrewAI Enterprise
built-in tool
Microsoft AutoGen
built-in tool
Genspark
built-in tool
Agent Zero
built-in tool
NVIDIA NemoClaw
built-in tool
OpenHuman
built-in tool
Apple Intelligence
built-in tool
Sandcastle
Orchestrate sandboxed coding agents (isolated containers)
SuperAGI
Open-source autonomous-agent framework (self-hosted) (port 3000, web UI)
OpenHands (OpenDevin)
Open-source autonomous AI software engineer (self-hosted) (port 3000, web UI)
E2B
Secure cloud sandboxes for AI agents (spin up / clone / kill) (web UI)
Browserbase
Headless browser infrastructure for AI agents (cloud sessions) (web UI)
Manus
Autonomous general AI agent (cloud API) (web UI)
Devin
Cognition's AI software engineer (cloud API) (web UI)
GitHub Copilot
AI pair programmer — live org seat/usage monitor (web UI)
OpenAI Operator
OpenAI's browser-using agent (cloud) (web UI)
Hyperagent
Airtable's fleet-of-agents platform (cloud) (web UI)
Herdr
Agent multiplexer — tmux for AI coding agents (terminal)
T3 Code
Open-source control surface for the coding agents on your Mac (web UI)
ChatGPT Work Sites
OpenAI's work agent + published Sites/web apps (alpha) (web UI)
Lakebed
Agent-native runtime for full-stack TypeScript capsules (alpha) (port 3000, web UI)
6.46FinOps & Cloud Cost
Infracost
Cost estimates for Terraform, in CI (self-hosted CLI / cloud)
OpenCost
CNCF open-source Kubernetes cost monitoring (self-hosted) (port 9003, web UI)
Kubecost
Kubernetes cost visibility & optimization (self-hosted / cloud) (port 9090, web UI)
CloudZero
Cloud cost intelligence & unit economics (cloud) (web UI)
Vantage
Multi-cloud cost reporting & optimization (cloud) (web UI)
Finout
No-agent FinOps platform with unified cost (cloud) (web UI)
CloudHealth
Multi-cloud cost & governance (VMware/Broadcom, cloud) (web UI)
AWS Cost Explorer
Native AWS cost analysis & forecasting (API) (web UI)
GCP Cloud Billing
Google Cloud billing reports, budgets & BigQuery export (API) (web UI)
Azure Cost Management
Native Azure (and AWS) cost analysis & budgets (API) (web UI)
6.47Containers
Containers
built-in tool
Kubernetes Clusters
built-in tool
Docker
built-in tool
OrbStack
built-in tool
Vagrant
built-in tool
Kamal
built-in tool
Proxmox VE
Open-source virtualization — KVM VMs + LXC containers (port 8006, web UI)
VMware vSphere
Enterprise virtualization — ESXi hypervisor + vCenter (port 443, web UI)
Microsoft Hyper-V
Windows Server hypervisor (Type-1)
XCP-ng
Open-source Xen hypervisor (XenServer alternative) (port 443, web UI)
Nutanix
HCI platform — AHV hypervisor + Prism management (port 9440, web UI)
Scale Computing HyperCore
SC//HyperCore HCI appliance (HC3) — REST API on :443 (port 443, web UI)
VergeOS
Verge.io — integrated virtualization, storage and networking (port 443, web UI)
HPE Morpheus
Hybrid-cloud management & orchestration (REST API) (port 443, web UI)
Platform9
Managed Kubernetes / private cloud (SaaS control plane) (port 443, web UI)
Azure Local
Azure Stack HCI successor — monitored via Azure ARM, no local API (web UI)
OpenShift Virtualization
Run VMs alongside containers on OpenShift (KubeVirt) (web UI)
OpenStack
Open-source private-cloud IaaS platform (web UI)
VMware vMotion
Live-migrate running VMs between ESXi hosts
Proxmox VE Live Migration
Live-migrate KVM VMs across Proxmox cluster nodes
Hyper-V Live Migration
Move running Hyper-V VMs between hosts with no downtime
Watchtower
Auto-update running Docker containers
Podman
Daemonless, Docker-compatible containers
Apple Container
Apple's native `container` tool — Linux containers in per-container VMs
Lima
Linux virtual machines (container machines) on macOS
Colima
Container runtimes on macOS via Lima (Docker/containerd/k8s)
OrbStack
Fast Docker & Linux machines for macOS
Kubernetes
The container orchestrator (kubectl) (port 6443)
Helm
The Kubernetes package manager (charts)
Dev Containers (VS Code)
Reproducible dev environments in a container
K3s
Lightweight certified Kubernetes (self-hosted) (port 6443)
minikube
Local single-node Kubernetes for development
kind
Kubernetes IN Docker — disposable clusters
k3d
k3s in Docker — lightweight multi-node clusters
k0s
Zero-friction single-binary Kubernetes (port 6443)
MicroK8s
Canonical's low-ops Kubernetes (snap) (port 16443)
RKE2
Rancher's security-focused Kubernetes (Gov-grade) (port 6443)
Talos Linux
API-managed immutable OS purpose-built for Kubernetes (port 50000)
kubeadm
The official cluster bootstrapper (vanilla K8s) (port 6443)
OpenShift / OKD
Red Hat's enterprise Kubernetes platform (port 6443, web UI)
Rancher Desktop
Desktop Kubernetes + container runtime for Mac
nerdctl
Docker-compatible CLI for containerd
Docker Swarm
Docker-native clustering (docker swarm / stack) (port 2377)
Portainer
Web UI for Docker & Kubernetes (self-hosted) (port 9443, web UI)
Rancher
Multi-cluster Kubernetes management (self-hosted) (port 443, web UI)
Nomad
HashiCorp workload orchestrator (self-hosted) (port 4646, web UI)
6.48Service Mesh (Kubernetes)
Istio
Envoy-based service mesh for Kubernetes
Linkerd
Lightweight, fast CNCF service mesh
Consul Connect
HashiCorp Consul service mesh & discovery (port 8500, web UI)
Cilium Service Mesh
eBPF-based, sidecarless service mesh & CNI
Kuma
Universal service mesh (Kong, CNCF) (port 5681, web UI)
Gloo Mesh
Istio-based multi-cluster service mesh (solo.io)
NGINX Service Mesh
Lightweight service mesh on NGINX/NGINX Plus (F5)
AWS App Mesh
Managed Envoy service mesh on AWS (ECS/EKS/EC2)
Kong Gateway
Cloud-native API gateway on Envoy/Nginx (self-hosted / cloud) (port 8001)
Tyk
Open-source API gateway & management (self-hosted / cloud) (port 8080, web UI)
Apache APISIX
Dynamic, high-performance API gateway (self-hosted) (port 9180, web UI)
Envoy Gateway
Gateway API management plane for Envoy Proxy (self-hosted)
6.49Apps & CMS
WordPress
built-in tool
WordPress Sites
built-in tool
RevenueCat
built-in tool
Drupal
built-in tool
Joomla
built-in tool
Statamic
built-in tool
Grav
built-in tool
Kirby
built-in tool
Craft CMS
built-in tool
ClassicPress
WordPress fork without the block editor (web UI)
Backdrop CMS
Drupal 7 fork for small-to-medium sites (web UI)
Bedrock (Roots)
Composer-managed WordPress boilerplate
Trellis (Roots)
Ansible server provisioning for WordPress
WordPress Playground
WordPress running in WebAssembly — no server needed (port 9400, web UI)
Ghost
Modern publishing & newsletter platform (port 2368, web UI)
Webflow
Visual website builder & hosted CMS (cloud) (web UI)
Framer
Design-first website builder with hosted CMS (cloud) (web UI)
Instatic
Self-hosted visual CMS with an AI page editor (open-source) (port 3001, web UI)
6.50Knowledge & Memory
Knowledge Folder
built-in tool
Knowledge Notes
built-in tool
GraphRAG
Graph-based retrieval-augmented generation (Microsoft)
Graphify
Turn a codebase into a queryable knowledge graph (AI coding-assistant skill)
Khoj
Self-hosted AI second brain — chat with your notes, docs and the web (port 42110, web UI)
Logseq
Local-first outliner & PKM (Markdown/Org)
Notion
All-in-one workspace — docs, wikis, databases (cloud)
DokuWiki
Flat-file PHP wiki — the closest macOS Server “Wiki” replacement (port 80, web UI)
MediaWiki
The wiki engine behind Wikipedia (PHP/MySQL) (port 80, web UI)
Wiki.js
Modern self-hosted wiki (Node.js) (port 3000, web UI)
BookStack
Self-hosted docs/wiki organised as books (PHP) (port 6875, web UI)
Outline
Self-hosted team knowledge base (real-time) (port 3000, web UI)
Trilium Notes
Hierarchical personal notes (self-hosted server + app) (port 8080, web UI)
Zotero
Reference & research manager (app + API)
Readwise
Highlights sync & read-later (cloud API)
Memos
Lightweight, privacy-first notes/memo hub (port 5230, web UI)
Linkding
Minimal, fast self-hosted bookmark manager (port 9090, web UI)
Karakeep
AI bookmark/read-it-later (formerly Hoarder) (port 3000, web UI)
Wallabag
Self-hosted read-it-later (Pocket alternative) (port 80, web UI)
Docmost
Open-source collaborative wiki & docs (Confluence/Notion alt.) (port 3000, web UI)
AFFiNE
Docs + whiteboard + database (Notion/Miro alt.) (port 3010, web UI)
AppFlowy
Open-source Notion alternative (docs/boards/DBs) (web UI)
Joplin Server
Sync server for Joplin notes (E2EE) (port 22300, web UI)
Shiori
Simple self-hosted bookmark manager (Go) (port 8080, web UI)
SurfSense
Self-hosted NotebookLM/Perplexity alternative (port 3000, web UI)
6.51E-Commerce
Store Health
built-in tool
Sales Channels
built-in tool
Square
built-in tool
WooCommerce
WordPress e-commerce plugin (PHP) (web UI)
Adobe Commerce (Magento)
Enterprise PHP commerce platform (port 80, web UI)
Shopware
Symfony-based commerce platform (PHP) (port 80, web UI)
Saleor
GraphQL-first headless commerce (Python) (port 8000, web UI)
Medusa
Node.js headless commerce engine (port 9000, web UI)
Vendure
Node.js/GraphQL headless commerce (port 3000, web UI)
Stripe
Payments & checkout API (cloud) (web UI)
PayPal
Online payments & checkout (cloud) (web UI)
DOKU
Indonesian payment gateway (cards, e-wallets, VA, QRIS) (web UI)
Mollie
European payments (iDEAL, cards, SEPA) (cloud) (web UI)
Paddle
Merchant-of-record for software sales (cloud) (web UI)
Lemon Squeezy
Digital-products storefront & MoR (legacy — moving to Stripe) (web UI)
Braintree
PayPal's card/wallet gateway (GraphQL API) (cloud) (web UI)
PAY.JP
Japanese card payments API (cloud) (web UI)
KOMOJU
Japanese multi-method payments (konbini, cards, wallets) (web UI)
Adyen
Enterprise payments platform (webhook/report-driven) (web UI)
Wise
Multi-currency business account & payouts (cloud) (web UI)
GMO Payment Gateway
Japan's largest PSP (per-order API; no list API) (web UI)
Shopify
Hosted commerce platform & channel (cloud) (web UI)
Amazon
Amazon marketplace selling channel (cloud) (web UI)
FedEx
Shipping rates, labels & tracking (cloud) (web UI)
UPS
Shipping rates, labels & tracking (cloud) (web UI)
DHL
Shipping rates, labels & tracking (cloud) (web UI)
eBay Seller Hub
eBay marketplace selling channel (cloud) (web UI)
Etsy
Handmade/vintage & POD marketplace (cloud) (web UI)
Walmart Marketplace
Walmart marketplace selling channel (cloud) (web UI)
6.52QR & Link Management
QR & Link Health
built-in tool
BL.INK
Enterprise link management (cloud) (web UI)
Bitly
Links, QR codes, analytics (cloud) (web UI)
Rebrandly
Branded short domains (cloud) (web UI)
Short.io
Teams, custom domains (cloud) (web UI)
Dub.co
Modern marketing links & QR (open-source core) (web UI)
QR Code Generator PRO
Dynamic QR codes (cloud) (web UI)
Beaconstac (Uniqode)
QR analytics & management (cloud) (web UI)
Flowcode
Marketing QR dashboards (cloud) (web UI)
Scanova
QR campaign management (cloud) (web UI)
QR TIGER
Dynamic QR management (cloud) (web UI)
GS1 Digital Link
Own your product-QR resolver (self-host or SaaS) (web UI)
6.53Student Information Systems
PowerSchool SIS
K-12 student information system (cloud) (web UI)
PowerSchool Attendance
Attendance tracking within PowerSchool (cloud) (web UI)
Blackbaud SIS
Independent/private-school SIS (cloud) (web UI)
FACTS SIS
Private/faith-based school SIS (cloud) (web UI)
Infinite Campus
K-12 SIS & state reporting (cloud) (web UI)
Veracross
All-in-one independent-school platform (cloud) (web UI)
openSIS
Open-source student information system (self-hosted) (web UI)
RosarioSIS
Open-source SIS (PHP/PostgreSQL, self-hosted) (web UI)
SchoolPass
Attendance, dismissal & safety (cloud) (web UI)
RFID/NFC Attendance
Tap-card attendance with RFID/NFC readers (self-hosted) (web UI)
6.54Learning Management
Canvas LMS
Instructure Canvas — courses, assignments, grading (web UI)
Blackboard Learn
Higher-ed LMS (cloud) (web UI)
Schoology
K-12 LMS by PowerSchool (cloud) (web UI)
Google Classroom
Google's classroom & assignment tool (cloud) (web UI)
Moodle
Open-source LMS (self-hosted, PHP) (web UI)
Open edX
MOOC-scale open LMS (self-hosted) (web UI)
ILIAS
Open-source LMS (self-hosted, PHP) (web UI)
BigBlueButton
Open-source virtual classroom (self-hosted) (web UI)
Zoom
Video meetings & online classes (app)
Google Meet
Google's video meetings (cloud) (web UI)
ExamSoft
Secure exam delivery & analytics (cloud) (web UI)
ProctorU
Online exam proctoring (cloud) (web UI)
TAO Testing
Open-source assessment platform (self-hosted) (web UI)
6.55Digital Library
EBSCOhost
Research databases & e-journals (cloud) (web UI)
ProQuest
Dissertations, e-journals & databases (cloud) (web UI)
JSTOR
Academic journals & books archive (cloud) (web UI)
Koha
Open-source integrated library system (self-hosted) (web UI)
DSpace
Open-source institutional repository (self-hosted) (web UI)
Greenstone
Open-source digital-library builder (self-hosted) (web UI)
6.56Campus & School Ops
aSc Timetables
School timetable generator (desktop)
Mimosa Scheduling
Timetabling / scheduling software (desktop)
FET Timetabling
Open-source automatic timetabling (self-hosted/desktop)
Slate Admissions
Admissions & enrolment CRM (cloud) (web UI)
OpenApply
Admissions & enrolment for K-12 (cloud) (web UI)
Finalsite Enrolment
School websites & enrolment (cloud) (web UI)
FACTS Tuition Management
Tuition billing & payment plans (cloud) (web UI)
Flywire Education Payments
Cross-border tuition payments (cloud) (web UI)
StarRez
Student housing & residential life (cloud) (web UI)
eRezLife
Residence life & housing management (cloud) (web UI)
Ellucian Banner
Higher-ed ERP / student system (cloud or self-hosted) (web UI)
Workday Student
Cloud ERP for higher education (cloud) (web UI)
ParentSquare
School-home communication (cloud) (web UI)
Remind
Teacher-family messaging (cloud) (web UI)
Asset Panda
Asset & device tracking (cloud) (web UI)
Incident IQ
K-12 IT helpdesk & asset management (cloud) (web UI)
ClassLink
Education SSO & rostering (cloud) (web UI)
6.57Sourcing & Suppliers
AliExpress
Global supplier marketplace for drop-shipping (cloud) (web UI)
Alibaba
B2B wholesale sourcing (cloud) (web UI)
CJdropshipping
Sourcing + warehousing + fulfilment (cloud) (web UI)
Spocket
US/EU-supplier drop-ship marketplace (cloud) (web UI)
Zendrop
Drop-ship sourcing & auto-fulfillment (cloud) (web UI)
SaleHoo
Vetted supplier directory (cloud) (web UI)
DSers
AliExpress order automation (official) (cloud) (web UI)
6.58Print-on-Demand
Printful
Print-on-demand & fulfilment (cloud) (web UI)
Printify
Print-on-demand marketplace (cloud) (web UI)
Gelato
Global/local print-on-demand network (cloud) (web UI)
Gooten
Print-on-demand fulfilment platform (cloud) (web UI)
6.59Shipping & Fulfilment
Drop-shipping Health
built-in tool
AfterShip
Universal shipment tracking across 1,000+ carriers (cloud) (web UI)
ShipStation
Multi-channel order & label management (cloud) (web UI)
Easyship
Global shipping rates, duties & labels (cloud) (web UI)
Shippo
Multi-carrier rates, labels & tracking API (cloud) (web UI)
Pirate Ship
Free, discounted USPS/UPS labels (cloud) (web UI)
6.60Inventory Sync
SkuVault
Warehouse & inventory management (cloud) (web UI)
Cin7
Inventory & order management (cloud) (web UI)
Zoho Inventory
Multi-channel inventory & order management (cloud) (web UI)
Katana Cloud Inventory
Manufacturing & inventory control (cloud) (web UI)
zaiko Robot
Japanese multi-store stock sync — Rakuten, Yahoo!, Amazon, carts, POS (cloud) (web UI)
6.61Profit Analytics
Triple Whale
E-commerce profit & attribution dashboard (cloud) (web UI)
Lifetimely
P&L and LTV analytics for Shopify (cloud) (web UI)
BeProfit
Profit & expense tracking dashboard (cloud) (web UI)
6.62Mesh Networking
RNS Nodes
built-in tool
Reticulum
Cryptography-based mesh networking stack (any medium)
Nomad Network (NomadNet)
Resilient comms over Reticulum (pages, files, messaging)
Sideband
LXMF messaging app over Reticulum (desktop/mobile)
Meshtastic
LoRa mesh radio for text & location (off-grid)
RNode LoRa Devices
Open LoRa radio interface for Reticulum (flash & configure)
Yggdrasil
Self-arranging encrypted IPv6 mesh (experimental)
cjdns / Hyperboria
Encrypted IPv6 mesh routing (source-routed)
B.A.T.M.A.N.-adv
Layer-2 community Wi-Fi mesh routing (Linux)
OLSR (olsrd)
Optimized Link State Routing for MANETs
Babel (babeld)
Robust distance-vector mesh routing protocol
Briar
P2P messaging over Tor, Wi-Fi & Bluetooth
AREDN
Amateur-radio high-speed mesh (ham licence)
qaul
Internet-independent P2P mesh messaging app
Serval Mesh
Off-grid mesh comms (Serval Project)
Ratspeak
Private, account-free mesh messaging (Reticulum-based)
6.63Anonymity Networks
Tor
Onion-routing anonymity network (client/relay/bridge/onion service) (port 9050, brew: tor)
I2P
Garlic-routed network — router, tunnels, eepsites, messaging (port 7070, web UI)
6.64Secrets & Vaults
Vault Links
built-in tool
Bitwarden
Password manager — cloud or official self-host (web UI)
Vaultwarden
Self-hosted Bitwarden-compatible server (Docker) (port 8222, web UI)
HashiCorp Vault
Secrets, PKI & dynamic credentials (self-hosted) (port 8200, web UI)
Step CA
Your own private certificate authority (self-hosted) (port 8443)
Let's Encrypt
Free TLS certificates via ACME — health & renewal monitor
Infisical
Open-source secrets for app configs (cloud or self-hosted) (port 8080, web UI)
Doppler
Hosted secrets & config manager (cloud) (web UI)
1Password SCIM Bridge
Automated 1Password user provisioning (self-hosted bridge) (port 3002)
1Password
Password manager with developer secrets API (cloud) (web UI)
Keeper Security
Password manager & Secrets Manager (cloud API) (web UI)
6.65Monitoring
Unified Health History
HTTP/HTTPS, TCP, Ping, SIP, local processes, remote helpers and service APIs feed the same one-minute health board, response-time history, rolling uptime and transition log
Network-aware checks
Scope local targets to a saved network identity (router MAC, subnet and Wi-Fi identity); they pause outside that network without requesting the Mac's or phone's location
Private mobile widgets
Overview, multi-server, multi-service and single-service focus widgets, plus Lock Screen overview widgets; only sanitized health names and states enter the App Group
Cloud API monitoring
GitHub account/repository/Actions health, API quota and release-asset downloads; Anthropic and GitHub Copilot account monitoring; broad SaaS API metrics and thresholds
Disk Health
built-in tool
Service Guardian
built-in tool
Grafana
Dashboards for any data source (self-hosted) (port 3000, web UI, brew: grafana)
Prometheus
Time-series metrics & alerting (self-hosted) (port 9090, web UI, brew: prometheus)
Alertmanager
Route and deduplicate Prometheus alerts (self-hosted) (port 9093, web UI)
Node Exporter
Unix host metrics for Prometheus (self-hosted) (port 9100, web UI, brew: node_exporter)
Windows Exporter
Windows host metrics for Prometheus (remote) (port 9182, web UI)
Zabbix
Enterprise monitoring — agents, SNMP, triggers (self-hosted) (port 8080, web UI)
Nagios Core
The classic check-based monitor (self-hosted) (port 80, web UI)
Checkmk
Auto-discovering IT monitoring (self-hosted) (port 8080, web UI)
Paessler PRTG
Network, server and infrastructure monitoring (Windows or hosted) (port 443, web UI)
Healthchecks.io
Cron & heartbeat monitoring (cloud or self-hosted) (web UI)
Datadog
Hosted metrics, logs, traces and synthetics (SaaS) (web UI)
AppSignal
Application errors, performance, uptime and deploys (SaaS) (web UI)
New Relic
Hosted APM, infrastructure and logs (SaaS) (web UI)
Sentry
Error tracking and performance monitoring (web UI)
Honeycomb
Observability for high-cardinality events and traces (web UI)
Dynatrace
Enterprise observability and AIOps platform (web UI)
Matomo
Full-featured self-hosted web analytics (port 80, web UI)
Plausible
Lightweight, privacy-first analytics (port 8000, web UI)
Umami
Simple, privacy-focused analytics (Node) (port 3000, web UI)
GoAccess
Real-time access-log analyser (CLI/HTML)
Netdata
Real-time system metrics dashboard (port 19999, web UI, brew: netdata)
Uptime Kuma
Self-hosted uptime monitor (port 3001, web UI)
Scrutiny
S.M.A.R.T. drive health dashboard (port 8080, web UI)
Glances
Cross-platform system monitor (web/API) (port 61208, web UI)
Beszel
Lightweight server monitoring hub + agents (port 8090, web UI)
Speedtest Tracker
Scheduled internet speed tests + history (port 80, web UI)
UptimeRobot
Cloud uptime/SSL monitoring with status pages (web UI)
NUT (Network UPS Tools)
UPS monitoring server (upsd) for many devices (port 3493)
Homepage
Self-hosted services dashboard (gethomepage.dev) (port 3000, web UI)
PeaNUT
Modern web dashboard for NUT UPS servers (port 8080, web UI)
NinjaOne
Endpoint monitoring, patching and automation (SaaS RMM) (web UI)
Atera
RMM, patching, ticketing and automation (SaaS) (web UI)
Site24x7
Infrastructure, application, network and experience monitoring (SaaS) (web UI)
ManageEngine Applications Manager
Application, server, VM and capacity monitoring (port 8443, web UI)
ManageEngine OpManager Nexus
Unified network, server and IT operations management (port 8060, web UI)
Pulseway
Mobile-first RMM, patching and endpoint automation (web UI)
FirstWave NMIS
Open network fault, performance and configuration monitoring (port 8042, web UI)
N-able N-central
Unified endpoint management, RMM and patching (port 443, web UI)
Netreo
Full-stack infrastructure and business-service observability (port 443, web UI)
Pandora FMS
Infrastructure, application, log and synthetic monitoring (port 80, web UI)
Atatus
APM, logs, infrastructure and real-user monitoring (SaaS) (web UI)
Infraon IMS
Unified infrastructure, network and configuration monitoring (port 443, web UI)
Naverisk RMM & PSA
Cross-platform RMM, service desk and PSA (web UI)
Server Density
Hosted server, service and container monitoring (web UI)
6.66Security Tools
Security
built-in tool
Malware Audit
built-in tool
Security Audit
built-in tool
EDR Fleet
built-in tool
Fail2ban
Bans IPs after suspicious activity (intrusion prevention) (brew: fail2ban)
Suricata
High-performance IDS/IPS engine (self-hosted)
Snort
The classic network IDS (self-hosted)
CrowdSec
Behavioural detection + IP blocking (crowd-sourced) (port 8080, brew: crowdsec)
OSSEC
Host-based IDS: log, file-integrity & rootkit monitoring
LuLu
Free open-source outbound firewall (macOS app)
Burp Suite
Web app security testing — intercepting proxy & scanner (macOS app) (port 8080)
Vibe Proxy
AI-assisted web security testing & intercepting proxy
Yakit
Open-source web security testing platform & MITM (macOS app)
Strix
AI-assisted penetration testing from the local CLI
Fuzzilli
Coverage-guided JavaScript engine fuzzer (reviewed local binaries)
OWASP ZAP
Open-source web-app security scanner (DAST) — spider, active scan, proxy (port 8080)
Intego NetBarrier
Intego's two-way Mac firewall (NetBarrier X9 / Intego ONE)
Little Snitch
Commercial network monitor & firewall (macOS app)
Murus
GUI front-end for the macOS pf firewall (app)
Radio Silence
Lightweight macOS outbound firewall (app)
Vallum
Per-app outbound firewall & throttle (app)
Hands Off!
Per-app network + disk access control (app)
NetBarrier
Two-way macOS firewall (Intego, app)
ClamAV
Open-source antivirus engine (self-hosted) (brew: clamav)
YARA
Pattern-matching engine for malware (self-hosted)
AbuseIPDB
Crowd-sourced IP reputation / blocklist (cloud API) (web UI)
Phishing Catcher
Catch phishing domains from CT logs (self-hosted)
URLhaus
Malware-URL feed & lookup API (cloud · abuse.ch) (web UI)
OpenPhish
Live phishing-URL feed (cloud) (web UI)
MISP
Threat-intelligence sharing platform (self-hosted) (port 443, web UI)
CAPE Sandbox
Malware sandbox w/ config extraction (self-hosted) (port 8000, web UI)
Cuckoo Sandbox
Automated malware-analysis sandbox (self-hosted) (port 8090, web UI)
YARA-X
YARA rewritten in Rust — faster CLI scanner (self-hosted)
Volatility 3
Memory-forensics framework (self-hosted)
capa
Detect capabilities in executables (self-hosted)
oletools
Analyse malicious Office docs / OLE (self-hosted)
radare2
Reverse-engineering framework / disassembler (self-hosted)
binwalk
Firmware / embedded-file carving & analysis (self-hosted)
Nuclei
Template-based vulnerability scanner (self-hosted CLI)
OpenCTI
Cyber threat-intelligence platform (self-hosted) (port 8080, web UI)
TheHive
Security incident-response platform (self-hosted) (port 9000, web UI)
Cortex
Observable analysers & responders engine (self-hosted) (port 9001, web UI)
IntelOwl
OSINT / threat-intel analysis platform (self-hosted) (port 443, web UI)
AlienVault OTX
Open Threat Exchange IOC feed (cloud) (web UI)
GRR Rapid Response
Remote live-forensics / IR framework (self-hosted) (port 8000, web UI)
OpenEDR
Open-source endpoint detection & response (self-hosted) (web UI)
Santa
macOS binary allowlisting / blocklisting (self-hosted)
KnockKnock
Reveal persistently installed Mac software (self-hosted)
BlockBlock
Monitor & block persistence in real time (self-hosted)
ThreatLocker
Zero Trust app allowlisting & endpoint control (agent + cloud portal)
OPSWAT MetaDefender
Multi-engine malware scanning & file CDR (self-hosted / API) (port 8008, web UI)
osquery
Query your endpoint like a database (agent)
Fleet
Self-hosted osquery fleet manager (web UI + API) (port 8080, web UI)
Velociraptor
Endpoint visibility & DFIR hunting (self-hosted) (port 8889, web UI)
Zeek
Network security monitor / traffic analysis (self-hosted)
OpenVAS / Greenbone
Vulnerability scanning (self-hosted) (port 9392, web UI)
CrowdStrike Falcon
Cloud-native EDR/XDR (macOS sensor + API)
SentinelOne
Autonomous EDR/XDR (macOS agent + API)
Microsoft Defender for Endpoint
Microsoft EDR for macOS (agent + Graph API)
Sophos Central
Endpoint protection / MDR (macOS agent + API)
Bitdefender GravityZone
Endpoint protection / EDR (macOS agent + API)
Malwarebytes
Anti-malware (macOS app; business via Nebula API)
Huntress
Managed EDR/MDR for SMB & MSPs (agent + API)
Jamf Protect
Mac-native endpoint security (agent + API)
LimaCharlie
API-first SecOps cloud / EDR (agent + API)
Airlock Digital
Application allowlisting & execution control (agent + API)
Admin By Request
Endpoint privilege management / just-in-time admin (agent + API)
CyberArk EPM
Endpoint Privilege Manager (agent + API)
BeyondTrust EPM
Endpoint Privilege Management for Mac (agent + API)
AutoElevate (CyberFOX)
MSP privilege elevation & local-admin control (agent + API)
VirusTotal
Multi-engine file/URL reputation (API)
Cloudmersive
Virus-scan & content-protection API (cloud / self-host)
Hybrid Analysis
Malware sandbox (Falcon Sandbox) — API
Kolide
Device trust & posture (osquery-based agent + API)
AdGuard
Ad/tracker blocker app + AdGuard DNS & VPN (commercial)
CyberChef
The cyber-Swiss-army-knife for data (web UI)
6.67SIEM & Security Data
SIEM Overview
built-in tool
Wazuh
Open-source SIEM & XDR (self-hosted) (port 443, web UI)
Security Onion
NSM + SIEM + IDS Linux distro (self-hosted) (port 443, web UI)
Graylog
Centralized log management (self-hosted) (port 9000, web UI)
Splunk
Enterprise log search, SIEM and observability (port 8000, web UI)
Elastic Security
Elastic SIEM, XDR and cloud-security analytics (hybrid) (port 5601, web UI)
Microsoft Sentinel
Cloud-native SIEM and SOAR on Microsoft Azure (web UI)
Google Security Operations
Google SecOps SIEM and SOAR (formerly Chronicle) (web UI)
IBM QRadar SIEM
Enterprise SIEM for events, flows and offenses (hybrid) (port 443, web UI)
Sumo Logic Cloud SIEM
Cloud SIEM, detections and security analytics (web UI)
Rapid7 InsightIDR
Cloud SIEM with user behavior and incident detection (web UI)
LogRhythm SIEM
Enterprise SIEM, analytics and response platform (port 443, web UI)
Devo
Cloud-native security analytics and SIEM (web UI)
FortiSIEM
Fortinet SIEM for infrastructure and security events (port 443, web UI)
OpenText ArcSight
Enterprise SIEM and security operations platform (port 8443, web UI)
VirtualMetric DataStream
Security-data pipeline for collection, normalization and routing (port 443, web UI)
Cribl Stream
Vendor-neutral telemetry pipeline and security-data router (port 9000, web UI)
Logstash
ELK's ingest & transform pipeline (self-hosted) (port 9600, brew: logstash-full)
Vector
High-performance logs, metrics and security-data pipeline (port 8686, brew: vector)
Fluent Bit
Lightweight telemetry collector and forwarder (port 2020, brew: fluent-bit)
Fluentd
Plugin-rich log collector and routing layer (port 24224)
NXLog
Cross-platform Windows and Linux log collection
syslog-ng
Flexible syslog collection, filtering and forwarding (brew: syslog-ng)
OpenTelemetry Collector
Vendor-neutral telemetry collector and processor
6.68Secrets Scanning & Supply Chain Security
Snyk
Developer security — code, deps, containers & IaC (cloud + CLI) (web UI)
Dependabot
Automated dependency-update & security PRs (GitHub) (web UI)
Renovate
Automated dependency updates, any platform (self-hosted / app)
Trivy
All-in-one vuln, secret, IaC & SBOM scanner (self-hosted CLI)
Grype
Fast vulnerability scanner for images & SBOMs (self-hosted CLI)
Syft
Generate SBOMs from images & filesystems (self-hosted CLI)
Cosign
Sign & verify container images and artifacts (self-hosted CLI)
Sigstore
Keyless signing ecosystem — Cosign, Fulcio, Rekor (self-hosted / public)
Chainguard
Minimal, low/zero-CVE container images (cloud + chainctl) (web UI)
Socket
Proactive dependency / supply-chain attack detection (cloud + CLI) (web UI)
GitGuardian
Secrets detection across code & CI (cloud + ggshield CLI) (web UI)
Gitleaks
Open-source secrets scanner for git repos (self-hosted CLI)
TruffleHog
Find & VERIFY leaked secrets across code, git history, cloud & CI (self-hosted CLI)
OSV-Scanner
Dependency vulnerability scanner backed by OSV.dev (self-hosted CLI)
Lynis
Host security auditing & hardening for Unix/Linux/macOS (self-hosted CLI)
Semgrep Supply Chain
SAST + reachable-dependency (SCA) scanning (self-hosted CLI / cloud)
6.69Policy, Compliance & Governance
Vanta
Automated compliance — SOC 2, ISO 27001, HIPAA, GDPR (cloud) (web UI)
Drata
Continuous compliance automation & audit readiness (cloud) (web UI)
Secureframe
Compliance automation across 40+ frameworks (cloud) (web UI)
Sprinto
Compliance automation for fast-moving teams (cloud) (web UI)
Thoropass
Compliance + audit in one (formerly Laika, cloud) (web UI)
Hyperproof
Compliance operations & evidence management (cloud) (web UI)
OneTrust
Privacy, GRC & data governance suite (cloud) (web UI)
LogicGate Risk Cloud
No-code GRC & risk workflow platform (cloud) (web UI)
AuditBoard
Connected risk, audit & compliance platform (cloud) (web UI)
Eramba
Open-source GRC platform (self-hosted) (port 443, web UI)
SimpleRisk
Open-source risk management (self-hosted) (port 443, web UI)
OpenGRC
Open-source governance, risk & compliance (self-hosted) (port 8080, web UI)
OpenControl
Compliance-as-code documentation toolkit (self-hosted CLI)
Open Policy Agent (OPA)
General-purpose policy engine, Rego (self-hosted CLI) (port 8181)
Conftest
Test config files against OPA/Rego policies (CLI)
OPA Gatekeeper
OPA policy admission controller for Kubernetes (self-hosted)
Kyverno
Kubernetes-native policy engine, no new language (self-hosted)
HashiCorp Sentinel
Policy as code for the HashiCorp stack (CLI)
Checkov
Static policy scanning for IaC (self-hosted CLI)
Prowler
Open-source multi-cloud security & compliance scanner (CLI)
Scout Suite
Multi-cloud security-auditing tool (CLI)
CloudQuery
Cloud asset inventory as SQL (self-hosted CLI)
Steampipe
Query cloud APIs with SQL + compliance mods (CLI)
Cloud Custodian
Rules engine for cloud governance & remediation (CLI)
AWS Config
Native AWS resource configuration & compliance (API) (web UI)
AWS Security Hub
Aggregated AWS security findings & standards (API) (web UI)
OpenFGA
Open-source fine-grained authorization (Zanzibar-style, self-hosted) (port 8080)
Authzed / SpiceDB
Zanzibar-style permissions database (self-hosted / cloud) (port 50051)
Permify
Open-source fine-grained authorization service (self-hosted) (port 3476)
Aserto / Topaz
Authorization built on OPA + Zanzibar (self-hosted / cloud) (port 8383)
immudb
Immutable, cryptographically-verifiable database / audit log (self-hosted) (port 3322)
Securiti
Data privacy, security & governance platform (cloud) (web UI)
BigID
Data discovery, privacy & governance at scale (cloud) (web UI)
DataGrail
Privacy platform — DSR & data mapping automation (cloud) (web UI)
Transcend
Privacy & data-rights automation, incl. AI governance (cloud) (web UI)
MineOS
Data-governance & privacy operations platform (cloud) (web UI)
Osano
Consent management & privacy compliance (cloud) (web UI)
OpenMetadata
Open-source metadata, catalogue & lineage platform (self-hosted) (port 8585, web UI)
DataHub
Open-source metadata platform & data catalogue (self-hosted) (port 9002, web UI)
Amundsen
Open-source data discovery & metadata engine (self-hosted) (port 5000, web UI)
Apache Atlas
Metadata & governance for the Hadoop/data ecosystem (self-hosted) (port 21000, web UI)
Microsoft Purview
Data governance, compliance, retention & eDiscovery (cloud) (web UI)
Google Vault
Retention, legal hold & eDiscovery for Google Workspace (cloud) (web UI)
Smarsh
Communications capture, archiving & supervision (cloud) (web UI)
Logikcull
Self-service eDiscovery & legal hold (cloud, Reveal) (web UI)
Everlaw
Cloud litigation & eDiscovery platform (cloud) (web UI)
6.70MDM & Device Management
Apple Business Manager
built-in tool
Kandji
Apple MDM + endpoint security & compliance (agent + API)
Mosyle
Apple MDM + endpoint security (agent + API)
Jamf Pro
Apple MDM — device management & compliance (agent + API)
Microsoft Intune
Cross-platform MDM/MAM in Microsoft 365 (cloud + Graph API)
Addigy
Cloud Apple MDM for MSPs & IT teams (agent + API)
SimpleMDM
Straightforward Apple MDM with a clean REST API (cloud)
JumpCloud
Cloud directory + cross-platform MDM & SSO (agent + API)
Fleet (Apple MDM)
Open-source MDM + osquery for cross-platform device ops (self-hosted) (port 8080, web UI)
Munki
Open-source macOS software deployment (self-hosted)
MicroMDM
Open-source, self-hosted Apple MDM server — the Profile Manager replacement (port 8080)
NanoMDM
Minimal, scalable open-source Apple MDM server (port 9000)
AutoPkg
Automated macOS software packaging (CLI)
baramundi Management Suite
Modular UEM, patching, inventory and endpoint automation (port 443, web UI)
6.71Logging & Observability
Kibana
ELK's search & dashboard UI (self-hosted) (port 5601, web UI, brew: kibana-full)
Loki
Grafana's log store — like Prometheus, for logs (self-hosted) (port 3100, brew: loki)
Elastic Cloud
Hosted Elasticsearch, Kibana and observability (web UI)
Dozzle
Live Docker container log viewer (port 8080, web UI)
6.72Incident Management & On-Call
PagerDuty
On-call scheduling & incident response (cloud API) (web UI)
Opsgenie
Alerting & on-call by Atlassian (cloud API) (web UI)
incident.io
Slack-native incident response & on-call (cloud API) (web UI)
Rootly
Slack-native incident management (cloud API) (web UI)
6.73Status Pages
Statuspage
Atlassian's hosted status pages (cloud API) (web UI)
Better Stack
Uptime monitoring, incidents & status pages (cloud API) (web UI)
Gatus
Automated health checks + status page (port 8080, web UI)
6.74Mining
Mining Rigs
built-in tool
Braiins OS+
Open ASIC firmware (Antminer) — autotuning + API (port 4028, web UI)
Hive OS
Cloud mining fleet OS & dashboard (web UI)
Awesome Miner
Windows-based mining management for large fleets (web UI)
LuxOS / Foreman
ASIC firmware (LuxOS) & Foreman fleet management (port 4028, web UI)
6.75ML Workbench
MLflow
ML experiment tracking & model registry (self-hosted) (port 5000, web UI)
pandas
The standard Python DataFrame library
Polars
Fast multicore DataFrame library (Rust core)
scikit-learn
Classic machine-learning library for Python
XGBoost
Gradient-boosted decision trees (high-accuracy tabular ML)
PyTorch
Deep-learning framework (GPU/MPS accelerated)
Kaggle
Datasets, notebooks & competitions (CLI)
Kubeflow
ML toolkit & pipelines on Kubernetes (web UI)
ClearML
Experiment tracking, orchestration & MLOps (self-hostable) (port 8080, web UI)
Weights & Biases (Local)
Self-hosted experiment tracking & dashboards (port 8080, web UI)
DVC Studio
Data/model version control + experiment dashboard (web UI)
6.76AI Governance & Safety
Langfuse
Open-source LLM observability & tracing (self-hosted / cloud) (port 3000, web UI)
Helicone
LLM observability & gateway — logs, costs, caching (self-hosted / cloud) (web UI)
Arize Phoenix
Open-source LLM tracing & evaluation (self-hosted) (port 6006, web UI)
OpenLLMetry
OpenTelemetry instrumentation for LLM apps (SDK)
Promptfoo
Prompt/RAG testing, evals & LLM red-teaming (self-hosted CLI)
Ragas
Evaluation framework for RAG pipelines (Python)
Guardrails AI
Input/output validation guardrails for LLMs (Python)
NeMo Guardrails
Programmable guardrails for LLM conversations (NVIDIA, Python)
Lakera Guard
Real-time GenAI security — prompt-injection firewall (cloud / self-host) (web UI)
Protect AI
AI/ML security — model scanning & ML supply chain (cloud + OSS) (web UI)
garak
LLM vulnerability scanner / red-teaming (self-hosted CLI)
TruLens
Evaluation & tracking for LLM apps — feedback functions (Python) (web UI)
WhyLabs
AI observability & data/LLM monitoring (cloud + whylogs) (web UI)
Fiddler AI
AI observability & model monitoring with explainability (cloud) (web UI)
Credo AI
AI governance, risk & compliance platform (cloud) (web UI)
Holistic AI
AI governance, risk & audit platform (cloud + OSS) (web UI)
6.77GPU Infrastructure
NVIDIA DCGM
NVIDIA Data Center GPU Manager — telemetry & health (port 5555)
DCGM Exporter
Export NVIDIA GPU metrics to Prometheus (port 9400)
6.78Speech AI
Handy
Free local push-to-talk speech-to-text (Whisper)
Wispr Flow
AI voice dictation that types into any app
Voicebox
Open-source local voice-to-text for macOS
Scriberr
Self-hosted audio transcription app (WhisperX) with speaker diarization (port 8080, web UI)
Whisper
OpenAI's speech-to-text model (Python)
Whisper.cpp
Fast C/C++ Whisper inference (CPU/Metal)
Faster Whisper
CTranslate2 Whisper — up to 4× faster
Coqui TTS
Open-source text-to-speech & voice cloning (port 5002, web UI)
Piper TTS
Fast, local neural text-to-speech
VibeVoice
Microsoft's long-form, multi-speaker TTS
Kokoro TTS
Small, fast, high-quality open-weight TTS (82M)
Meetily
Local AI meeting notetaker (desktop app)
6.79Image & Video AI
ComfyUI
Node-graph Stable Diffusion / video workflows (port 8188, web UI)
AUTOMATIC1111 WebUI
Stable Diffusion web UI (txt2img/img2img) (port 7860, web UI)
Tesseract OCR
Open-source OCR engine — images/PDF scans to text (CLI)
InvokeAI
Pro Stable Diffusion studio (Unified Canvas) (port 9090, web UI)
Fooocus
Simplest Stable Diffusion — type a prompt, get art (port 7865, web UI)
AutoShorts
Local video → 9:16 short-clip finder (desktop)
Opus Clip
AI viral-clip generator (cloud SaaS + API) (web UI)
6.80MCP
MCP Servers
built-in tool
Fleet Skill
built-in tool
MCP Server
built-in tool
6.81Self-Hosted Apps
PhotoPrism
AI-powered photo library (port 2342, web UI)
ResourceSpace
Open-source digital asset management (self-hosted) (port 80, web UI)
Pimcore
Open-source PIM / DAM / CMS platform (self-hosted) (port 80, web UI)
Paperless-ngx
Scan, OCR & archive documents (port 8000, web UI)
Paperless-AI
AI auto-tagging & chat for Paperless-ngx (port 3000, web UI)
FreshRSS
Self-hosted RSS reader (PHP) (port 80, web UI)
Miniflux
Minimalist RSS reader (Go) (port 8080, web UI, brew: miniflux)
Mixpost
Self-hosted social media scheduling (port 80, web UI)
Mealie
Self-hosted recipe manager & meal planner (port 9000, web UI)
Tandoor
Recipe manager & meal planner (port 8080, web UI)
Grocy
Groceries & household ERP (port 80, web UI)
Dashy
Feature-rich homelab dashboard (port 4000, web UI)
Heimdall
Simple application start page (port 80, web UI)
Homer
Static, fast services dashboard (YAML) (port 8080, web UI)
6.82Web3
The Graph
built-in tool
Foundry
Fast Solidity toolkit (forge/cast/anvil) (port 8545)
Anvil
Local Ethereum testnet (Foundry) (port 8545)
Solidity
Smart-contract compiler (solc)
Hardhat
Ethereum dev environment (Node.js) (port 8545)
Ganache
Personal Ethereum blockchain (dev) (port 8545)
IPFS
Distributed file system (Kubo) (port 5001, web UI, brew: ipfs)
Ceramic
Decentralized data network (ComposeDB) (port 7007)
6.83Crypto
Bitcoin Core
Full Bitcoin node (bitcoind) (port 8332)
Ethereum Node
go-ethereum (geth) execution node (port 8545)
BTCPay Server
Self-hosted Bitcoin payment processor (port 23000, web UI)
XMRig
Monero (RandomX) CPU/GPU miner
6.84RPC Services
Alchemy
built-in tool
Infura
built-in tool
6.85Tools
Apache Tika
Content detection & text/metadata extraction (port 9998)
Gotenberg
Stateless API to convert documents to PDF (port 3000)
LanguageTool
Self-hosted grammar & style checker (offline Grammarly alternative) (port 8081)
LibreTranslate
Self-hosted machine-translation API (offline DeepL/Google Translate alternative) (port 5000, web UI)
SearXNG
Private metasearch engine (self-hosted) (port 8080, web UI)
Stirling-PDF
Self-hosted PDF toolbox (merge/split/OCR…) (port 8080, web UI)
IT-Tools
Handy developer/IT utilities in one page (port 80, web UI)
Excalidraw
Virtual hand-drawn whiteboard (port 80, web UI)
Penpot
Open-source design & prototyping (Figma alt.) (port 9001, web UI)
Whoogle Search
Private, ad-free Google results proxy (port 5000, web UI)
HTML Anything
Agentic HTML editor driven by your local AI CLI (port 3000, web UI)
Harper
Offline, Rust grammar checker (LanguageTool alt.)
6.86Home Automation
Apple Home
built-in tool
Power Control
built-in tool
Nori / SuperNori AI
AI family hub display + proactive family AI agent (cloud + device) (web UI)
Home Assistant
Open-source home automation hub (port 8123, web UI)
Music Assistant
Self-hosted music library + multi-room player server (Home Assistant companion) (port 8095, web UI)
Node-RED
Flow-based automation wiring (port 1880, web UI, brew: node-red)
Homebridge
Bridge non-HomeKit devices to Apple Home (port 8581, web UI)
ESPHome
Firmware for ESP IoT devices (Home Assistant) (port 6052, web UI)
openHAB
Vendor-neutral automation platform (port 8080, web UI)
6.87Cameras
motionEye
Web frontend for motion (DIY NVR) (port 8765, web UI)
RTSP Cameras
Any RTSP-streaming IP camera (port 554)
ONVIF Cameras
Standards-based camera discovery & control (port 80, web UI)
go2rtc
Camera stream restreamer (RTSP/WebRTC/HLS) (port 1984, web UI)
Tapo Cameras
TP-Link Tapo Wi-Fi cameras (RTSP/ONVIF) (port 554)
Frigate
NVR with real-time object detection (port 5000, web UI)
Scrypted
High-performance camera hub (port 11080, web UI)
Shinobi
Open-source video management (CCTV) (port 8080, web UI)
ZoneMinder
Full-featured CCTV / video surveillance (port 8095, web UI)
Agent DVR
Cross-platform NVR with AI detection (self-hosted) (port 8090, web UI)
Blue Iris
Powerful Windows NVR (run on a Windows host) (port 81, web UI)
6.88IoT
SwitchBot
built-in tool
Zigbee
built-in tool
Zigbee2MQTT
Bridge Zigbee devices to MQTT (no vendor hub) (port 8080, web UI)
Z-Wave (Z-Wave JS UI)
Control Z-Wave devices via MQTT + web UI (port 8091, web UI)
Matter
Commission & control Matter devices (port 5580)
Thread
Low-power mesh for Matter devices
OpenThread Border Router
Run your own Thread border router (self-hosted)
Bluetooth (BLE)
BLE sensors & trackers
Bluetooth Beacons
iBeacon / Eddystone proximity beacons (BLE)
TP-Link Kasa & Tapo
Kasa & Tapo plugs/bulbs/strips + the kasa CLI
Amazon Alexa
Voice assistant ecosystem
Google Home
Google Home / Nest ecosystem
HomePod
Apple smart speaker & Home hub (AirPlay 2 / Matter / Thread)
6.89MQTT Brokers
MQTT Message Bus
built-in tool
Sidekiq
Background jobs for Ruby (threaded workers on Redis)
Mosquitto
Eclipse MQTT broker (port 1883, brew: mosquitto)
EMQX
Scalable, clustered MQTT broker (port 1883, web UI, brew: emqx)
HiveMQ
Enterprise MQTT broker (Java) (port 1883, web UI)
6.90POS Systems
Toast POS
Restaurant POS platform (cloud) (web UI)
Lightspeed
Retail & hospitality POS (cloud) (web UI)
Floranext
All-in-one florist software — POS, e-commerce & orders (cloud) (web UI)
6.91CRM & Loyalty
Salesforce
The enterprise CRM (cloud) (web UI)
HubSpot
CRM + marketing/sales hubs (cloud) (web UI)
Zoho CRM
Affordable full-suite CRM (cloud) (web UI)
SuiteCRM
Self-hosted open-source CRM (PHP) (port 80, web UI)
EspoCRM
Lightweight self-hosted CRM (PHP) (port 80, web UI)
Odoo CRM
CRM inside the open-source ERP (Python) (port 8069, web UI)
Pipedrive
Sales-pipeline-first CRM (cloud) (web UI)
Square Loyalty
Points & rewards on Square (cloud) (web UI)
Loyalzoo
Digital loyalty for independents (cloud) (web UI)
Thanx
Guest engagement & loyalty for restaurants (web UI)
Punchh
Enterprise restaurant loyalty (PAR, cloud) (web UI)
VoucherVault
Self-hosted vouchers, gift cards & loyalty (port 8000, web UI)
6.92Helpdesk & Ticketing
Zammad
Open-source helpdesk & ticketing (self-hosted) (port 8080, web UI)
osTicket
Classic open-source support ticket system (PHP/MySQL) (port 80, web UI)
Freshdesk
Cloud helpdesk / customer support (API) (web UI)
6.93IT Assets
GLPI
Asset inventory & ITSM with CMDB (PHP/MySQL) (port 80, web UI)
Snipe-IT
Open-source IT asset management (PHP/MySQL) (port 80, web UI)
AssetTiger
Cloud asset tracking with barcodes (API) (web UI)
Lansweeper
IT asset discovery & inventory (cloud/on-prem API) (web UI)
Workwize
Global IT equipment lifecycle & logistics (cloud API) (web UI)
6.94Project Management
Jira
Issue tracking & agile project management (cloud API) (web UI)
Linear
Fast issue tracking for product teams (cloud, GraphQL API) (web UI)
Taiga
Open-source agile project management (self-hosted) (port 80, web UI)
OpenProject
Open-source PM with Gantt & roadmaps (self-hosted) (port 80, web UI)
Plane
Open-source Jira alternative (self-hosted) (port 80, web UI)
Leantime
Open-source PM for non-project managers (PHP/MySQL) (port 80, web UI)
Basecamp
Project management & team collaboration (cloud API) (web UI)
monday.com
Work OS — boards, projects & workflows (cloud API) (web UI)
Vikunja
Self-hosted to-do / task manager (port 3456, web UI)
Planka
Realtime kanban board (Trello alternative) (port 1337, web UI)
Kimai
Self-hosted time tracking (port 8001, web UI)
Focalboard
Self-hosted project boards (Trello/Notion alt.) (port 8000, web UI)
6.95PMS
Channel Manager
built-in tool
SuiteOp
built-in tool
Symplehost
AI property management for short-term rentals (cloud) (web UI)
Breezeway
Property operations & services for STRs (cloud) (web UI)
Operto
Smart-lock & guest-experience automation for STRs (cloud) (web UI)
PriceLabs
Dynamic pricing & revenue management for STRs (cloud) (web UI)
Beyond
Dynamic pricing, insights & direct booking for STRs (cloud) (web UI)
Wheelhouse
Dynamic pricing & market analytics for STRs (cloud) (web UI)
AirDNA
Short-term-rental market data & analytics (cloud) (web UI)
RankBreeze
Airbnb listing optimization & rank tracking (cloud) (web UI)
Truvi
Direct-booking website builder for STRs (cloud) (web UI)
Hostaway
Short-term-rental PMS & channel manager (cloud API) (web UI)
Guesty
STR property-management platform (Open API) (web UI)
OwnerRez
Vacation-rental PMS for owners & small managers (v2 API) (web UI)
Lodgify
Direct-booking website builder + channel manager (web UI)
Uplisting
STR PMS / channel manager (invite-only API) (web UI)
Streamline VRS
Enterprise vacation-rental management (partner-gated API) (web UI)
RemoteLock
Cloud access control for smart locks (REST API) (web UI)
Minut
Noise & occupancy sensors for rentals (Enterprise API) (web UI)
NoiseAware
Noise monitoring for rentals (partner-provisioned API) (web UI)
Hospitable
Guest-messaging automation & STR management (cloud) (web UI)
Hostfully
STR property-management platform & digital guidebooks (cloud) (web UI)
Boostly
SMS marketing & direct-booking growth for STRs (cloud) (web UI)
Cloudbeds
Hotel PMS, booking engine & channel manager (cloud) (web UI)
Beds24
PMS & channel manager with a deep API (cloud) (web UI)
AirHost
Japanese STR PMS & channel manager (cloud) (web UI)
HappyGuest
Digital guest directory & concierge for hospitality (cloud) (web UI)
Alexa Smart Properties
Managed Alexa for hotels & senior living (cloud) (web UI)
QloApps
Open-source hotel reservation system (port 80, web UI)
HotelDruid
Hotel/B&B management & bookings (port 80, web UI)
OpenHotel PMS
Open property-management system (web UI)
BookStack
Wiki/docs for SOPs & property info (port 80, web UI)
Easy!Appointments
Open-source appointment scheduling (port 80, web UI)
Turno
Vacation-rental cleaning & turnover scheduling (cloud) (web UI)
Rentals (Laravel)
Custom Laravel vacation-rental app (port 80, web UI)
6.96Meeting Rooms & Desk Booking
Skedda
Desk & space booking (cloud API) (web UI)
Robin
Room scheduling & desk booking (cloud API) (web UI)
Envoy Workplace
Workplace, visitor & desk management (cloud API) (web UI)
YAROOMS
Meeting room & desk booking (cloud API) (web UI)
OfficeSpace
Space management & desk/room booking (cloud API) (web UI)
Condeco (Eptura)
Enterprise room & desk booking (cloud API) (web UI)
DeskFlex
Desk & room reservation system (cloud API) (web UI)
Matrix Booking
Room, desk & resource booking (cloud API) (web UI)
6.97Coworking & Shared Spaces
OfficeRnD
Coworking & flex-space management (cloud API) (web UI)
Nexudus
Coworking management & white-label platform (cloud API) (web UI)
Optix
App-first coworking management (cloud API) (web UI)
Cobot
Coworking space management (cloud API) (web UI)
6.98Facilities & Maintenance
IBM Maximo
Enterprise asset management & CMMS (cloud/self-managed API) (web UI)
FMX
Facilities management & maintenance (cloud API) (web UI)
Archibus
IWMS — facilities, real estate & assets (API) (web UI)
6.99Accounting & ERP
Money Forward Cloud
Japanese cloud accounting & back office (cloud) (web UI)
freee
Japanese cloud accounting & HR (cloud) (web UI)
Xero
Cloud accounting for small business (cloud) (web UI)
ERPNext
Open-source ERP — accounting, inventory, HR (self-hosted) (port 8080, web UI)
Odoo
Open-source ERP suite — self-hosted (Python + PostgreSQL) (port 8069, web UI)
QuickBooks
Intuit cloud accounting (cloud) (web UI)
Plaid
Bank account linking & financial data (cloud API)
Expensify
Expense & receipt management (cloud API) (web UI)
Firefly III
Self-hosted personal finance manager (port 8080, web UI)
Actual Budget
Fast local-first envelope budgeting (port 5006, web UI)
Ghostfolio
Open-source wealth/investment tracker (port 3333, web UI)
Invoice Ninja
Self-hosted invoicing & payments (port 80, web UI)
Maybe
Open-source personal finance / net worth (port 3000, web UI)
6.100Healthcare
OpenEMR
Open-source EHR & practice management (PHP/MySQL) (port 80, web UI)
OpenMRS
Open-source medical record platform (Java) (port 8080, web UI)
GNU Health
Hospital & health information system (Python/Tryton) (port 8000, web UI)
LibreHealth
Open-source EHR / toolkit (PHP/MySQL) (port 80, web UI)
Orthanc
Lightweight DICOM server / PACS (REST API) (port 8042, web UI)
OpenDolphin
Open-source EHR / electronic karte (Japan) (port 8080, web UI)
ORCA
Japan Medical Association receipt/billing system (port 8000, web UI)
6.101Automation & Workflows
Automatio.ai
AI no-code web automation & scraping (cloud) (web UI)
Zite
AI app & workflow builder (cloud) (web UI)
AppSheet
Google no-code app builder from a spreadsheet/DB (cloud) (web UI)
Make (Integromat)
Visual scenario automation + AI agents — 3,000+ apps (cloud) (web UI)
Zapier
Cloud iPaaS — connect 7,000+ apps (cloud) (web UI)
n8n
Source-available workflow automation (self-hosted) (port 5678, web UI)
Pipedream
Developer-first workflow automation (cloud) (web UI)
Power Automate
Microsoft cloud + desktop automation (cloud) (web UI)
Activepieces
Open-source no-code automation (self-hosted) (port 8080, web UI)
Windmill
Scripts → workflows & internal apps (self-hosted) (port 8000, web UI)
Huginn
Self-hosted agents that watch & act (self-hosted) (port 3000, web UI)
Flowise
Drag-and-drop LLM app builder (self-hosted) (port 3000, web UI)
Langflow
Visual builder for LLM/agent flows (self-hosted) (port 7860, web UI)
Dify
Open-source LLMOps / AI app platform (self-hosted) (port 80, web UI)
Elgato Stream Deck
Hardware macro keypad with LCD keys
Touch Portal
Turn a phone/tablet into a macro deck (no extra hardware)
Bitfocus Companion
Open-source control surface for larger automation workflows (port 8000, web UI)
X-keys
Programmable keypads for NOCs & operations
Matric
Phone macro deck with live metric tiles
QMK / VIA
Open keyboard firmware + live key remapping
6.102Workflow Orchestration
Temporal
Durable execution platform for reliable workflows (port 8233, web UI)
Restate
Durable execution for resilient services (single binary) (port 9070, web UI)
Apache Airflow
Programmatic data-pipeline orchestration (DAGs) (port 8080, web UI)
6.103HRIS Integration
Unified.to (HRIS API)
Unified API across HRIS providers (web UI)
Apideck (HRIS API)
Unified HRIS API & integration platform (web UI)
Truto
Unified API for HRIS & more (cloud) (web UI)
Bindbee
Unified HRIS / employment API (cloud) (web UI)
6.104VoIP & Telephony
Asterisk
The open-source PBX engine (self-hosted) (port 5060, brew: asterisk)
FreePBX
Web GUI distro on Asterisk (self-hosted, Linux) (port 80, web UI)
FreeSWITCH
Carrier-grade softswitch (self-hosted) (port 5060)
FusionPBX
Multi-tenant web GUI on FreeSWITCH (self-hosted) (port 443, web UI)
Issabel PBX
Unified-communications distro on Asterisk (self-hosted) (port 443, web UI)
Kamailio
High-performance SIP server/proxy (self-hosted) (port 5060)
OpenSIPS
SIP proxy/router for large platforms (self-hosted) (port 5060)
PBXact
Sangoma's commercial PBX (appliance/cloud) (port 80, web UI)
Plivo
Voice & SMS API platform (cloud) (web UI)
Telnyx
Carrier-grade voice, SIP trunking & numbers (cloud) (web UI)
Bird (MessageBird)
Omnichannel CPaaS — SMS, voice, WhatsApp (cloud) (web UI)
Sinch
Global SMS, voice & verification CPaaS (cloud) (web UI)
Twilio Voice
Programmable voice calls & TwiML (cloud) (web UI)
VitalPBX
Modern Asterisk-based PBX distro (self-hosted) (port 443, web UI)
Vonage APIs
Voice, SMS & video APIs (cloud, ex-Nexmo) (web UI)
Wazo Platform
API-first open telecom platform (self-hosted) (port 443, web UI)
Yate
Flexible telephony engine — SIP/H.323/SS7 (self-hosted) (port 5060)
3CX
Commercial software PBX (self-hosted or hosted) (port 443, web UI)
6.105Contact Centre & IVR
Twilio Studio
Drag-and-drop IVR & call-flow builder (cloud) (web UI)
Twilio Flex
Programmable contact centre (cloud) (web UI)
Amazon Connect
AWS cloud contact centre (cloud) (web UI)
Genesys Cloud
Enterprise CX platform — Architect IVR (cloud) (web UI)
Five9
CCaaS with strong outbound dialing (cloud) (web UI)
Talkdesk
AI-forward cloud contact centre (cloud) (web UI)
RingCentral Contact Center
CCaaS on the RingCentral platform (cloud) (web UI)
8x8 Contact Center
UCaaS + CCaaS in one platform (cloud) (web UI)
Vonage Contact Center
Salesforce-centric contact centre (cloud) (web UI)
Dialpad Ai Contact Center
AI-native contact centre & real-time coaching (cloud) (web UI)
Aircall
Lightweight cloud call centre for teams (cloud) (web UI)
CloudTalk
Cloud calling for support & sales (cloud) (web UI)
GoTo Connect
Phone system + contact centre (cloud) (web UI)
Zoom Contact Center
Omnichannel CC on the Zoom platform (cloud) (web UI)
Freshdesk Contact Center
Freshworks phone channel (ex-Freshcaller, cloud) (web UI)
Zendesk Talk
Voice channel inside Zendesk Support (cloud) (web UI)
Intermedia Contact Center
CCaaS bundled with Intermedia Unite (cloud) (web UI)
6.106SEO & Marketing
Analytics
built-in tool
IndexNow Manager
built-in tool
Cloudflare Analytics
Privacy-first web & edge analytics (cloud) (web UI)
Ahrefs
Backlinks, keywords & rank tracking (cloud) (web UI)
Google Search Console
Search performance, indexing & sitemaps (cloud) (web UI)
Google Analytics
GA4 web & app analytics (cloud) (web UI)
PageSpeed Insights / CrUX
Core Web Vitals & Lighthouse scores per URL (cloud) (web UI)
Plausible Analytics
Privacy-first, self-hostable web analytics (port 8000, web UI)
Umami
Simple, self-hosted, privacy-focused analytics (port 3000, web UI)
Matomo
Full GA-style analytics, self-hosted (web UI)
GoatCounter
Minimal, open-source web analytics (port 8081, web UI)
PostHog
Self-hostable product analytics suite (port 8000, web UI)
Bing Webmaster Tools
Bing search performance & URL submission (cloud) (web UI)
Yandex Webmaster
Yandex search performance & indexing (cloud) (web UI)
Semrush
Keywords, competitors & site audit (cloud) (web UI)
Moz
Domain Authority & backlinks (cloud) (web UI)
Majestic
Backlink index — Trust & Citation Flow (cloud) (web UI)
DataForSEO
SERP, keyword & backlink data API (cloud) (web UI)
SerpApi
Real-time SERP scraping API (cloud) (web UI)
Yahoo! JAPAN Ads & Search
Japan's #2 search/ads ecosystem (cloud) (web UI)
Ptengine
Analytics + heatmaps, popular in Japan (web UI)
KARTE
Real-time user/CX analytics (PLAID, JP) (web UI)
AdEbis (アドエビス)
Ad attribution & marketing analytics (JP) (web UI)
Naver Search Advisor
Naver's Search Console (KR) — IndexNow partner (web UI)
Naver Analytics
Naver's free web analytics (KR) (web UI)
Beusable
Heatmap & UX analytics (KR) (web UI)
Airbridge
Mobile attribution & analytics (AB180, KR) (web UI)
adbrix
Mobile attribution & analytics (IGAWorks, KR) (web UI)
Google Lighthouse
Audit performance, PWA, SEO & accessibility
Shlink
Self-hosted URL shortener with REST API & analytics (port 8080, web UI)
YOURLS
Your Own URL Shortener (PHP) (port 80, web UI)
Kutt
Modern open-source URL shortener (port 3000, web UI)
Polr
Minimalist self-hosted link shortener (Laravel) (port 80, web UI)
Dub.co
Open-source link management for marketing teams (port 8888, web UI)
Nahpet
Self-hosted URL shortener with custom domains & analytics (port 3000, web UI)
Flink (URL Shortener)
Self-hosted shortener that keeps the path after the alias (port 8080, web UI)
Chhoto URL
Tiny, fast self-hosted URL shortener (Rust) (port 4567, web UI)
6.107Conversion Rate Optimization
Optimizely
Enterprise A/B testing & experimentation (cloud) (web UI)
VWO
A/B testing, heatmaps, surveys (cloud) (web UI)
AB Tasty
Personalization & experimentation (cloud) (web UI)
Statsig
Modern experimentation & feature flags (cloud, API) (web UI)
GrowthBook
Self-hosted A/B testing & feature flags (open-source) (port 3100, web UI)
Mixpanel
Product analytics & funnels (cloud) (web UI)
Amplitude
Product analytics & journeys (cloud) (web UI)
Hotjar
Heatmaps & session recording (cloud) (web UI)
Microsoft Clarity
Free heatmaps & session recording (cloud) (web UI)
FullStory
Digital experience & session replay (cloud) (web UI)
Lucky Orange
Heatmaps, recordings, live chat (cloud) (web UI)
Mouseflow
Session replay & heatmaps (cloud) (web UI)
Heap
Autocapture funnels & journeys (cloud) (web UI)
Contentsquare
Experience analytics & journeys (cloud) (web UI)
UserVoice
Product feedback & feature requests (cloud) (web UI)
Canny
Feature-request boards (cloud, API) (web UI)
Survicate
Website & in-product surveys (cloud) (web UI)
Qualtrics
Experience-management surveys (cloud) (web UI)
LaunchDarkly
Enterprise feature-flag management (cloud, API) (web UI)
Unleash
Self-hosted feature-flag management (open-source) (port 4242, web UI)
6.108Social Media
Buffer
Social media scheduling & publishing (cloud API) (web UI)
Postiz
Open-source, self-hosted social media scheduler (port 5000, web UI)
Postly
AI-powered social media publishing platform (web UI)
Post Planner
Content discovery & social scheduling (web UI)
Postcron
Multi-platform social media scheduler (web UI)
Publer
Social media scheduling & analytics (web UI)
Hootsuite
Social media management suite (cloud API) (web UI)
Later
Visual social scheduling (Instagram-first, cloud API) (web UI)
Metricool
Social analytics, scheduling & ads (cloud API) (web UI)
SocialPilot
Social scheduling for teams & agencies (cloud API) (web UI)
Mastodon
Self-hosted federated microblogging (ActivityPub) (web UI)
strfry
Fast C++ Nostr relay (single binary, one-click Docker) (port 7777)
nostr-rs-relay
Rust Nostr relay on SQLite (one-click Docker) (port 8080)
Nostream
TypeScript Nostr relay — Postgres, paid relays (Docker Compose) (port 8008)
HAVEN
Personal Nostr relay suite + Blossom media (Docker Compose) (port 3355, web UI)
Blossom Server
Nostr media/blob server — images & files (one-click Docker) (port 3000, web UI)
Pixelfed
Federated photo sharing (Instagram alt.) (port 80, web UI)
Lemmy
Federated link aggregator (Reddit alt.) (port 8536, web UI)
Misskey
Federated microblogging (rich Mastodon alt.) (port 3000, web UI)
6.109Media Servers
MediaMTX
RTSP/RTMP/HLS/WebRTC/SRT media server (port 8554, brew: mediamtx)
SRS
Simple Realtime Server — RTMP/WebRTC/SRT (port 1935, web UI)
Owncast
Self-hosted live streaming + chat (port 8080, web UI)
Restreamer
Restream one input to many platforms (port 8080, web UI)
Icecast
Audio streaming server (net radio) (port 8000, web UI, brew: icecast)
AzuraCast
Complete self-hosted radio station (port 80, web UI)
Jellyfin
Free home media server (Plex alternative) (port 8096, web UI, brew: jellyfin)
Plex Media Server
Popular home media server (port 32400, web UI)
Emby
Media server with live TV/DVR (port 8096, web UI)
PeerTube
Federated, P2P video platform (ActivityPub) (port 9000, web UI)
Navidrome
Self-hosted music server (Subsonic-compatible) (port 4533, web UI)
Audiobookshelf
Self-hosted audiobook & podcast server (port 13378, web UI)
Tvheadend
TV streaming server & DVR (DVB/IPTV) (port 9981, web UI)
TSDuck
MPEG transport-stream toolkit (CLI)
Wowza Streaming Engine
Commercial streaming server (RTMP/SRT/HLS) (port 8088, web UI)
Immich
Self-hosted photo & video backup (Google Photos alt.) (port 2283, web UI)
Channels DVR Server
Whole-home DVR for live TV & streaming (self-hosted) (port 8089, web UI)
Jellyseerr
Media request manager (Jellyfin/Plex/Emby) (port 5055, web UI)
Bazarr
Automatic subtitles for Sonarr/Radarr (port 6767, web UI)
Tdarr
Distributed media transcoding/health automation (port 8265, web UI)
Komga
Comics & manga server (self-hosted) (port 25600, web UI)
Kavita
Fast ebook/comic/manga server (port 5000, web UI)
RomM
Self-hosted ROM manager & player (port 8080, web UI)
Overseerr
Media request manager for Plex (port 5055, web UI)
Ombi
Media request system (Plex/Emby/Jellyfin) (port 3579, web UI)
Airsonic-Advanced
Self-hosted music streaming (Subsonic API) (port 4040, web UI)
Calibre-Web
Web reader/manager for a Calibre ebook library (port 8083, web UI)
Tautulli
Plex monitoring, history & stats (port 8181, web UI)
6.110Download Automation
qBittorrent
Open-source BitTorrent client with Web UI (self-hosted) (port 8080, web UI)
Transmission
Lightweight BitTorrent client + daemon (self-hosted) (port 9091, web UI)
SABnzbd
Usenet (NZB) downloader with Web UI (self-hosted) (port 8080, web UI, brew: sabnzbd)
NZBGet
Lightweight, efficient Usenet downloader (self-hosted) (port 6789, web UI)
Sonarr
Automated TV series management (self-hosted) (port 8989, web UI)
Radarr
Automated movie management (self-hosted) (port 7878, web UI)
Lidarr
Automated music collection management (self-hosted) (port 8686, web UI)
Readarr
Automated book & audiobook management (self-hosted) (port 8787, web UI)
Prowlarr
Indexer manager for the *arr stack (port 9696, web UI)
Tube Archivist
Self-hosted YouTube archive (index + watch) (port 8000, web UI)
Pinchflat
Self-hosted YouTube media downloader/archiver (port 8945, web UI)
6.111AV & Stage
AV Feeds
built-in tool
Dante (Audinate)
Audio-over-IP networking (AoIP)
Q-SYS
QSC's AV processing & control platform (port 1710, web UI)
QLC+
Open-source DMX lighting control (port 9999, web UI)
grandMA3
MA Lighting console / onPC show control
grandMA2
MA Lighting grandMA2 console / onPC
Depence²
Real-time 3D previz & show control (Syncronorm)
PixMob
Crowd LED wearables for stadium light shows
Xylobands
RF-controlled LED wristbands for events
OBS Studio
Live production, streaming & recording (port 4455)
NDI
Video-over-IP for production (NDI) (port 5959)
Resolume Arena / Avenue
VJ / media-server software (port 8080, web UI)
MadMapper
Projection mapping & LED control
Liquidsoap
Scriptable radio/audio stream engine
MPV
Scriptable media player (CLI)
Kodi
Media centre with JSON-RPC remote (port 8080, web UI)
VLC
Player with HTTP/telnet remote interfaces (port 8080, web UI)
Yodeck
Cloud digital signage (Pi players) (web UI)
Screenly / Anthias
Digital signage — cloud or open source (port 80, web UI)
Google Cast / YouTube Cast
Chromecast casting & control (port 8009)
ArKaos GrandVJ / XT
Live VJ mixing & video mapping
ArKaos MediaMaster (ChamSys)
Stage media server for lighting desks
Syphon
GPU frame sharing between Mac apps
SRT (tools)
Secure Reliable Transport for live video (port 9710)
WebRTC (WHIP/WHEP)
Sub-second video in any browser (port 8889)
AirServer
Turn this Mac into an AirPlay/Cast/Miracast receiver
Reflector
AirPlay/Cast screen receiver (Squirrels)
Chrome Remote Desktop
Free remote control of this Mac (web UI)
Riverside.fm
Remote podcast & video recording studio (cloud) (web UI)
6.112Render Farm
AWS Deadline / Deadline 10
Render farm queue manager (VFX/3D)
OpenCue
Open-source render manager (self-hosted)
Qube!
Commercial render farm / job manager (PipelineFX)
6.113Tracking & Telematics
Traccar
Open-source GPS tracking server (self-hosted) (port 8082, web UI)
OwnTracks
Private self-hosted location tracking (MQTT/HTTP) (port 8083, web UI)
TeslaMate
Self-hosted Tesla data logger (Docker) (port 4000, web UI)
Samsara
Fleet telematics platform (cloud API) (web UI)
Geotab
Fleet telematics (MyGeotab API) (web UI)
Fleetio
Fleet maintenance management (cloud API) (web UI)
Onfleet
Last-mile delivery management (cloud API) (web UI)
Bouncie
Connected-car OBD tracker (cloud API) (web UI)
AutoPi
Programmable vehicle IoT dongle (cloud API) (web UI)
flespi
Telematics IoT gateway & MQTT broker (cloud API) (web UI)
Chapter 7
Sites, Domains & the Web
From the vhost on your Mac to the registrar, the DNS, the CDN and the search engines — one pane that tells you whether a domain is actually healthy, and a set of tools to fix it when it is not.
A working website is more than a running Apache. The domain has to resolve, the certificate has to be valid, the right machine has to answer, the CDN has to be in front of it, and the search engines have to know it exists. FrontierStack gathers all of that into the Sites pane and a small family of companion tools, so the whole chain — registrar, DNS, TLS, CDN, host, SEO — is visible and fixable from one window. This chapter covers the web above the stack; for the vhosts and certificates themselves see Chapter 4.
7.1The Sites pane and Domain Health
Open Sites from the sidebar. At the top sits the Domain Health section, a live dashboard that collects every hostname FrontierStack knows about: the local Apache and Nginx vhosts you have defined, the vhosts on linked servers, every Cloudflare zone on your token, and every domain in the registrar monitor. Each domain gets a row with a set of status badges; press Check on a row, or Check All in the header, and the app probes the domain end to end and colours the badges green or amber.
The point of the dashboard is to answer one question reliably: is this domain actually serving, and from where? Because the checks run against the public internet (a real DNS lookup, a real HTTP request, a real TLS handshake), they catch the failures a local config check never sees — a record that points at the wrong IP, an expired certificate, a Cloudflare zone stuck in "pending", a site that resolves but returns a 502.
| Check | How it is measured | What a problem looks like |
|---|---|---|
| DNS | A real resolver lookup of the hostname (host/dig) and the IP it returns. | No record, or an address that is not your server. |
| HTTP | A live request that records the status code (curl -w %{http_code}). | Anything outside 200–399 — a 404, a 502, a redirect loop. |
| SSL / TLS | A TLS handshake reading the certificate end date (openssl s_client → x509 -enddate); the badge shows days remaining. | Expired, expiring soon, or a name that does not match. |
| HTTP/3 | A teal badge when the server advertises HTTP/3 in its Alt-Svc header. Apache has no HTTP/3 of its own — the usual way to earn this badge on an Apache site is the HTTP/3 toggle in the domain's Cloudflare zone pane (browsers then speak QUIC to the edge while the origin stays h1/h2). Remember HTTP/3 rides on UDP 443: a TCP-only firewall makes browsers silently fall back to HTTP/2. | No badge on a site you expected to serve h3 — the edge setting is off, or UDP 443 is blocked. |
| Cloudflare | Zone status and plan from your token, shown as e.g. active · Pro. | A zone "pending" because the nameservers were never switched at the registrar. |
| Serving host | Derived from the answering IP and the Server header. | "This Mac (Apache)" when you expected a remote box, or "Cloudflare" masking the origin. |
7.2ChatGPT Sites: monitor, use your domain, or self-host
The ChatGPT Sites section uses one shared registry everywhere it appears in FrontierStack. Paste a public name.openai.chatgpt.site URL and it joins Domain Health, SEO and Alerts like any other site. Mark a workspace- or owner-only Site private and outside probes pause, because its sign-in page is not an outage.
Import or Move offers two owner-authorised routes. Use my domain keeps the Site on ChatGPT: first add the domain in the Site's ChatGPT settings, then copy the exact DNS records ChatGPT supplies. FrontierStack validates that every record belongs to the selected Cloudflare zone and publishes it DNS-only; for another DNS provider, add the records there and use Save Domain. Both paths keep the original Sites address and the custom domain in the registry. Return to ChatGPT and refresh the domain status after DNS propagates.
Self-host starts from the Site's local project folder. FrontierStack reads .openai/hosting.json and package.json, identifies the framework and ready output folder, shows D1/R2 bindings and the names of example environment variables, and copies the reviewed web output into a managed Apache domain. The importer never runs package scripts, never reads secret values, skips links and source-control metadata, limits the copy to 50,000 files or 5 GB, and uses a staging folder so a failed replacement can be rolled back. Build the project first, then import dist, build, out, public, or another folder containing index.html.
7.3Proving domain ownership
Vendors verify that a domain is yours by asking you to publish a DNS TXT record only its owner could create — the same proof-by-DNS idea as ACME's DNS-01 challenge, but every vendor has its own record format. The Verify button on a Domain Health row keeps those formats in one place: pick the service — Google (Search Console / Workspace), Microsoft 365, Meta, Apple Business Manager, Atlassian, OpenAI, Stripe, GitHub organizations, or a custom record — paste the token from the vendor's console, and FrontierStack publishes the TXT record straight into the domain's Cloudflare zone. If the domain isn't on your Cloudflare token, it hands you the exact record to add at your DNS host instead. A bare token is completed automatically (paste abc123 for Google and the record becomes google-site-verification=abc123).
The sheet also shows the verification records already published on the apex — a quick audit of who this domain is currently proven to — and Check DNS queries public DNS (1.1.1.1) for the new record, so you know the proof is visible before you press "Verify" on the vendor's side.
For certificates, the Let's Encrypt service pane (Security & Secrets category) is a standing health check on the other kind of domain proof: it watches the ACME API, Let's Encrypt's status page and a domain's live certificate, and — because ACME clients renew when 30 days remain — alerts when a certificate is overdue for renewal, catching broken certbot/acme.sh automation weeks before visitors ever see an expiry warning.
7.4AI SEO and "Fix My Site"
Two of the badges on a domain row are not just diagnostics — they are buttons that hand the problem to the AI Administrator. Fix My Site takes a broken or misbehaving site and runs the assistant through a fixed playbook: reproduce the fault by curling the site locally with its Host header, read the relevant logs, check that Apache, PHP and the database are running, and then state the single most likely root cause with concrete next steps. With Allow changes off it only advises; with it on it may apply the reversible fixes (restart a service, correct a wrong value in a config file, repair the database). There is a WordPress-aware variant for the classic white screen, "Error establishing a database connection", broken permalinks and stuck maintenance mode.
The SEO action runs an on-device read-only audit: the assistant fetches the home page, robots.txt and the sitemap, scores the site out of 100 and writes a short report (titles, meta descriptions, headings, crawlability, structured data). The result opens in an SEO report sheet so you can read the findings and act on them.
7.5One-click CMS installs (Apps & CMS)
WordPress gets a single pane that both installs new sites and runs the ones you already have — on this Mac or on any fleet server. That merge matters: the old installer pane could only ever write to This Mac, whereas everything here runs through WP-CLI on whichever host you pick, so a remote server is a first-class target for a new install. Install a new WordPress site, at the foot of the pane, downloads WordPress onto the selected host, writes wp-config.php, creates the database and completes setup with the administrator account you name. Nothing is copied up from your Mac, and an install already sitting at that path is refused rather than overwritten. Serving the new folder still needs a virtual host — create one in the Sites pane for a local site, or on the server's own web server. Installing a CMS is only the first day of its life, and the same pane covers the rest. Choose a host — This Mac or any fleet server — and scan for wp-config.php under the usual web roots, and every WordPress install on that machine appears with its core, plugin and theme versions and whatever is waiting to be updated. Update all exports the database before it touches anything, because a bad plugin update is recoverable and a lost database is not. Check integrity compares the core files against the checksums WordPress.org publishes, which is the quickest way to find a defaced or backdoored install; add a free WPScan token and the pane also checks your installed plugins and core against the vulnerability database, marking anything with no published fix. Multisite networks list their subsites. Each site also carries an Add a plugin list — a curated catalogue covering booking, commerce, mail delivery, backups, caching and security — which installs straight onto that site, local or remote, with an option to activate it once installed. The list is deliberately not a mirror of the WordPress.org directory: every entry either fails visibly when it breaks or produces something FrontierStack already monitors elsewhere, and each says what the app can tell you about it once it is running, so an install never implies monitoring that does not exist. Anything already on the site shows as installed rather than being offered twice, and a premium plugin with no WordPress.org slug links to its own page instead. On a host with no WordPress site yet — or without WP-CLI — the catalogue is still shown, greyed out and not selectable, so you can see what will be on offer instead of meeting an empty pane. The remaining jobs are the ones that otherwise mean an SSH session and a half-remembered command: resetting the password of a locked-out administrator, search-replace to move a site between domains (WP-CLI rewrites URLs buried in serialized PHP, where a plain SQL replace corrupts them — so always dry-run first), cloning a site to staging, and exporting or optimising the database. A clone copies the files, gives the copy its own database, rewrites the URLs inside it and sets it to discourage search engines, so staging can never write to production or outrank it. Everything runs through WP-CLI over SSH, and the pane offers to install WP-CLI on any host that lacks it. Pin a site and Alerts will tell you about pending updates, a failed integrity check or a new vulnerability.
If your WordPress lives on managed hosting rather than your own machines, the hosting panes now list those sites too: WP Engine, Kinsta, Cloudways and Pressable each pull your installs through their API — environment, primary domain and status — and they roll up into Cloud Servers alongside your VPS instances, so one inventory covers everything you run. These are sites rather than machines, so they carry no power controls.
The Apps & CMS section installs the other self-hosted CMS onto your Apache/PHP/MySQL stack in a single flow, each with its own pane: Drupal, Joomla, Statamic, Grav, Kirby, Craft CMS and FreshRSS. The installer downloads the app (or runs composer create-project for the Composer-based Statamic and Craft), extracts it into the document root, and — for the ones that need a database (Drupal, Joomla, Craft) — creates the database and user and writes the config where the app expects it. The flat-file CMS (Grav, Kirby, Statamic) need no database at all. It then opens the app's setup or admin page so you can create your account (/admin, /panel, /cp, /admin/install…), while FrontierStack wires the virtual host, PHP and trusted HTTPS around it. For the install folder you can pick a site Apache already manages — a menu prefills its domain, document root and port — or Choose… a new empty folder; a matching Apache vhost is created for a new folder, or updated when the domain is an existing site. If an install misbehaves, Fix My Site (AI) above debugs it.
FreshRSS is the exception that finishes the job. It is a self-hosted RSS and Atom reader, and unlike the CMS above it leaves you no setup wizard at all: name an account and password in the pane, and the installer downloads the release, creates the database, runs FreshRSS's own command-line installer to write its configuration and build the schema, creates that account, and registers a virtual host pointing at p/ — the subfolder FreshRSS actually serves from, with the rest of its code left outside the web root where it belongs. The browser then opens on the login screen of a working reader rather than on step one of an installation. Because its API is Google Reader-compatible, mobile clients such as Reeder and NetNewsWire can sync against it once you expose it, which makes it a natural companion to the HTTPS and remote-access work elsewhere in this book.
7.6The Domain Registrar monitor
Sites tells you whether a domain works today; the Domain Registrars pane (in the DNS category) tells you whether it will keep working. Add a domain and FrontierStack watches three things on a schedule and raises an alert when any of them drifts:
- Expiry — the registration end date, registrar and nameservers, pulled over RDAP (with a
whoisfallback). Works for any domain, whatever the registrar. - DNS — whether the domain still resolves (
dig). - SSL — the certificate expiry, checked directly with
openssl.
A renewal warning fires when the expiry is within your reminder window, already past, or when auto-renew is off. For supported registrars the pane can import your domain list and auto-renew status by API — GoDaddy, Porkbun, Gandi, Value Domain, Route 53 (via the AWS CLI) and Cloudflare (reusing the Cloudflare token — this one needs a user API token, as Cloudflare Registrar does not accept account-owned cfat_ tokens). Registrars without a usable list API (Namecheap, Squarespace, Onamae) you add by hand; RDAP still monitors them.
domain_check (read-only) and domain_register tools, the latter gated behind an explicit confirmation. Registration reuses your stored registrar credentials and a registrant-contact profile you fill in once.7.7Cloudflare: zones, DNS, cache and tunnels
The Cloudflare pane is where you paste an API token and choose which zones appear in the sidebar. Each zone you Pin to sidebar becomes its own pane with that zone's Cloudflare/DNS/HTTP/SSL health, DDoS and bot protection, WAF rules, Workers, CDN analytics, development mode and cache purging (everything, a list of URLs, or by prefix). Scope the token carefully: a read-only token lists zones, but DNS edits, certificate DNS-01 validation, Dev Mode, cache purge and zone creation each need their own permission, and creating a brand-new zone needs the account-level Zone · Zone · Edit permission. The pane links straight to Cloudflare's token templates, a Test Token button probes the live API and lists exactly which of those abilities the token has or lacks (reads are exercised directly; writes are probed with deliberately-invalid requests, so nothing is changed), and a Dashboard button deep-links into the Cloudflare web console for the current zone.
When a pinned zone shows a warning or its HTTP check has stopped answering, the pane's Diagnose button finds out why instead of leaving you with a coloured dot. It probes each layer of the serving path in order — the zone's state at Cloudflare, the public nameservers, DNS resolution, HTTPS through the edge (decoding Cloudflare's 52x errors: 521 origin down, 522 timeout, 524 the app or its database hanging, 525/526 origin TLS), the origin server's ports 80 and 443 directly, and finally the machine FrontierStack knows serves the domain: the local web server if that is this Mac, or a linked server's on-host monitor service states (a stopped mysql surfaces right in the report). When the public path is broken it also sweeps the fleet: which linked servers are up, which binds the origin IP, and which already serves this domain's vhost — so a host that went offline and took the sites' front-door IP with it is named directly, together with the server that could take over. Each layer is shown pass/fail, ending with a plain-language conclusion — which layer broke and what to do about it.
Cloudflare turns up across the app: the AI's dns_record tool writes records into a zone you manage and updates existing ones in place — including flipping a subdomain between proxied (orange cloud) and DNS-only — issue_certificate can validate over Cloudflare DNS-01, and email_auth_dns can publish SPF/DMARC for you (see Chapter 13). The same account also powers Cloudflare DDNS and the Cloudflare Tunnel for exposing a local site — both covered in Chapter 9.
7.8Hosting providers
Not everything you run lives on a Mac. The Hosting category brings VPS and managed providers into the same window. VPS providers — DigitalOcean, Vultr, Linode, Hetzner, Sakura and others — expose their servers through an API token: paste it, and the pane lists each server with plan, location, status and IP, and lets you power one on, off or restart with a confirmation. Dashboard-style providers (managed hosting such as Hostinger) store their token and surface quick links to the control panel, docs and sign-up. Either way the credential lives in the Keychain, and the servers you can reach over SSH become part of your fleet (Chapter 8).
7.9IndexNow: instant search-engine submission
When a page changes, you do not have to wait for a crawler to notice. IndexNow Manager (in SEO & Marketing) tells the participating engines — Bing, Yandex, Seznam, Naver and others — immediately. Pick one of your managed sites, press Install Key File, and FrontierStack writes the <key>.txt file into the site's document root so the engines can confirm you own the key; Verify checks it is being served. Then submit a single URL, fire off the pending queue, or feed it from a sitemap, and it can auto-submit on a schedule. Everything goes to api.indexnow.org, which fans out to all participating engines; the URL's host must match the selected site and its key.
gsc_verify_domain and index_site tools, hands-off when you are signed in to Google. The Index button on each Domain Health row drives both paths at once.7.10Site Transfer: copying sites between machines
Two tools move a site without a manual rsync dance. Copy Websites Between Apache handles the local case: when you have more than one Apache install on the Mac (say a Homebrew one and an old Server.app one), choose the source install, tick the sites you want, and FrontierStack copies their document roots and vhost definitions into the currently selected Apache. Sites with the same domain are overwritten, so it is also how you re-import after a migration.
To move a site to another machine, the AI's promote_site tool clones a local site to one named fleet host: it uploads the document root, writes the vhost (Apache or Nginx) on the far side, reloads the web server, and can add the Cloudflare A record pointing at the new host — the same steps as a manual fleet push, in one call.
7.11Provisioning a new web project
The pieces above combine into a single flow for standing up a project's infrastructure from nothing. The idea is a clean division of labour: your AI tool (over MCP) owns the code; FrontierStack owns the infrastructure. The built-in Provision Web Project skill walks the assistant through the recipe in order:
- Discover — inventory the target, its privilege access, installed Apache/Nginx and connected DNS provider; identify or install missing prerequisites before making a public change.
- Zone —
cloudflare_zone_createmakes the Cloudflare zone and returns the nameservers to set at the registrar (and tells you plainly if the token lacks account-level zone-create rights). - Vhost + folder —
vhost_createdefines the Apache/Nginx site. If you did not provide a document root, FrontierStack creates an empty platform-appropriate folder and reports its path. It does not design or generate site content. - DNS —
dns_recordpoints the name at the host. - TLS —
issue_certificateissues a Let's Encrypt certificate. - Preview — a temporary share for a localhost test point (Chapter 9).
- Promote — optionally
promote_siteclones it onto a fleet host.
Domain registration can join the front of this recipe through domain_register, so an agent can in principle buy the name, create the zone, stand up the vhost, issue the certificate and clone to the fleet — with every money-spending or system-changing step previewed for your approval first.
Part III
Link servers into one fleet, then network, harden and monitor them all from a single window — Macs, Linux and BSD boxes, Raspberry Pis and Windows hosts alike.
Chapter 8
Connecting Servers: Locations & the Fleet
One Mac is a start. FrontierStack reaches out over SSH to every other server you run — and knows where on the network it is sitting when it does.
Everything so far has been about the Mac in front of you. This part of the manual widens the lens to the whole estate: the Linux boxes in a rack, a vintage Xserve still running macOS Server, a Raspberry Pi on a shelf, a cloud VPS, even a Windows host. You link each one once over SSH, and from then on FrontierStack treats them as a single fleet — running diagnostics, fanning commands out, deploying sites, and watching their health. It also keeps track of where this Mac is on the network, so a laptop that moves between home, office and a café doesn't fire false alarms about servers it simply can't see right now.
This chapter covers linking and running the fleet. Chapter 9 goes deeper on the network and perimeter, Chapter 10 on hardening and the security audits, and Chapter 11 on continuous monitoring and alerts. The AI Administrator can drive almost everything here over the same tools — see Chapter 13.
8.1Locations & Places
Open Locations & Places ▸ Locations. A location is simply a named network — Home, Office, On VPN — recognised from several signals: the Wi-Fi SSID, the router (gateway) MAC address, the Wi-Fi BSSID, the subnet prefix of your IP address (e.g. 192.168.1.), your public IP block, and whether a VPN is up. The header shows where you are right now (Now: Office), with the live snapshot beneath it: Wi-Fi name, IP, gateway and VPN state. Detection runs every 30 seconds.
When FrontierStack sees a network it doesn't recognise it offers a New network detected banner — click Add… to save it. You can also press Add Current Network as Location, then refine the criteria: a location matches when all the set criteria hold (with SSID and router MAC treated as any-of), so leaving a field blank simply ignores it. When several locations match, the most specific one wins rather than the first in the list. Use the Mode picker to pin a location manually instead of auto-detecting — handy when the signals are ambiguous.
Not all signals are equally trustworthy, and this matters more than it sounds. A subnet prefix is not an identity: home routers, cafés and hotels hand out 192.168.1.× everywhere, so a location defined only by its subnet would happily match a completely different building. The router MAC is the strongest signal — it is unique to one piece of hardware and readable without any special permission — which is why Update all criteria from current network is the one-click fix for a location that was saved before router matching existed.
8.17.1Pinning a place with GPS
For the awkward case — two sites that genuinely share a subnet and you would rather not fuss with MAC addresses — a location can also carry a GPS pin. Stand in the place, open the location and press Pin This Spot (GPS); a Radius slider sets how far counts as "here" (150 m by default, because indoor positioning is coarse and a site is a building, not a point).
The pin is a cross-reference, not a requirement. It does two things: it lets a weak match be confirmed, and — more usefully — it lets a wrong one be vetoed, so Home stops claiming a café that happens to use the same subnet. To keep that from ever making detection worse, a location identified only by shared criteria (a subnet, a VPN toggle) is no longer reported as confirmed when a position is available and contradicts it; you get Away / Unknown instead of a confident wrong answer.
Devices belong to Locations too. In Device Discovery, a monitored device's ⋯ menu ▸ Assign to Location places it at a specific site — or leave it Automatic, where it falls into whichever location owns its subnet. You can also set it from the device's own pane, and each location's row lists the devices assigned to it. Private subnets repeat between sites, so a device pinned elsewhere can land in a location by subnet; press its × in that list (or choose No Location) to remove it, and a matching subnet won't put it back. When the Mac arrives at a recognised location, FrontierStack checks those devices (skipping any seen recently, e.g. over VPN) and shows each one's status: green reachable, red if it should be here but isn't answering, and orange when it's on a Wi-Fi segment this Mac can't reach — usually a different access point or band, such as a 2.4 GHz-only sensor while the Mac is on 5 GHz. Orange means “can't verify from here”, not “gone”.
The point of all this is the Location-Dependent Monitoring section. Mark a device, Wi-Fi network, Cloudflare zone or watch as critical in Overview ▸ Alerts, then scope it here to Only at Office. That check is paused everywhere else: your NAS won't ring as DOWN from a hotel, and your home Wi-Fi won't alert as lost while you're at work. Paused items resume silently when you return. When the location itself changes, FrontierStack can post a local notification, send a "📍 Now at: Office" alert through your Messaging Gateways, or both.
get_location tool: the active location, how it was determined (pinned vs auto-detected), the live snapshot, and every configured location's criteria. It uses this to reason about whether a LAN-only service is reachable from where you are now, or whether you're away over VPN.8.2Linking a server over SSH
A server joins the fleet through the Link a Server sheet — reachable from a device's pane, from Device Discovery, or from the Cloud Servers and Remote Tools panes. Enter a name, the host or IP, the port, an SSH username (root, ubuntu, ec2-user…) and the login password. That password is used exactly once: the app installs this Mac's managed SSH key into the server's authorized_keys, then connects key-only from then on. Nothing is stored except the server's address — the password is discarded.
For a key-only server with no password login, expand Can't use a password? Install the key manually, copy the shown public key into the server's authorized_keys yourself, then link. Tick Also install the monitoring helper to set up the host monitor in the same step (covered below).
Linked servers carry a small green or red status dot for reachability. If it goes red with Permission denied (publickey) — typically after a server is reinstalled, or the key was never installed — the AI tool repair_ssh_access clears the stale host key and re-installs the managed key, using a one-time login password you keep as a vault secret. The password is read locally and re-installs key access; on success the dot turns green again.
The host's Status section also shows a Connection row: what actually carries the server's default route — the negotiated Ethernet rate (10 GbE, 2.5 GbE, 1 GbE), the Wi-Fi generation (Wi-Fi 7 = 802.11be, Wi-Fi 6E/6/5) with its channel width, or a VPN tunnel. It is read during the normal status probe on Linux, macOS and FreeBSD hosts, and reported by the host monitor agent (v1.17+) on agent-only hosts. The same row appears for This Mac, and on SNMP devices the Interfaces query now lists each port's negotiated link speed.
Each server also has a Connect via setting (in its Edit sheet) for interactive shells: plain SSH (default), mosh — which logs in over your SSH settings and then switches to its own UDP transport, so the session survives sleep, roaming and flaky links — or experimental SSH3 over QUIC/HTTP3, whose server can hide behind a secret URL on UDP 443. Open Shell and Open SSH honour the choice; probes and file transfers always stay on plain SSH. Both clients are in the Services catalogue (mosh via Homebrew, SSH3 via Go).
repair_ssh_access tool reads its one-time password from the local .env vault by name; the value is never sent to the AI model.8.3The managed key and the saved sudo password
Key access lets the app connect, but many useful operations — reading /var/log, editing Apache config, reloading a firewall — need root on the server. FrontierStack handles this with a per-host sudo password, saved in the macOS Keychain (never in plain files). It is captured automatically when you link a server, and you can set or change it later in the host's pane or in the Remote Tools target section (the Sudo password field).
When a root-only command runs, the helper primes sudo's credential cache with that saved password over the SSH session, then runs the command. If no password is saved, root operations fall back to passwordless sudo -n and simply report "needs sudo" when that isn't configured. Because secrets are referenced by name, you can keep several — for example a distinct MySQL password per server in the .env vault.
sudo -S over the encrypted SSH channel only when a root action actually runs, and they are never shown to the AI model or written to logs. Revoke one by clearing the field; re-enrol or re-key a single host without touching the others.8.4Fleet Run — one command across every node
Fleet & Remote ▸ Fleet Run fans a single operation out across all linked servers at once, or a selected subset, with a live per-host result. Pick your Targets (toggle hosts; the reachability dot shows which are up), choose an Operation, and press Run on N Server(s) — everything runs concurrently over SSH and each host reports back below, expandable to its full output.
Operations are OS-aware: a package update maps to apt, dnf, pacman, zypper, apk or brew depending on the host; a service restart tries systemd, then Homebrew. You never write per-OS commands by hand.
| Operation | What it does across the fleet |
|---|---|
| Update / upgrade all packages | Runs the host's package manager's update + upgrade. Confirmed before it fans out. |
| Install a package | Installs a named package (e.g. htop) on every selected host. |
| Restart a service | Restarts a named unit (e.g. nginx) via systemd or brew. |
| Check reboot-required | Reports which hosts are waiting on a reboot after updates. |
| Disk usage (df) | One-shot df across the fleet to spot a filling disk. |
| Uptime & load | Uptime and load average per host. |
| git pull a repo | Pulls a repository at a given path on each host — a quick deploy. |
| Custom command | Runs a verbatim shell command on every selected host. Double-check before fanning out. |
Fleet Run is the fastest way to spot drift: run Disk usage or Uptime & load to compare hosts at a glance, or use the file-checksum and health-check tools in Remote Tools (next) to find a config that's diverged across the fleet.
8.5Creating a container, here or on a server
Everywhere FrontierStack lists containers there is a Create Container… button, and they all open the same sheet: the Docker pane for this Mac, the same pane with a linked server chosen in the host picker, and the Docker tab of the Server Activity window. What you build runs on whichever target you started from — locally through the docker binary, or on a server over the SSH connection you already have.
Start from a preset or from blank. The presets cover plain images — nginx, PostgreSQL, MySQL, Redis, a throwaway Ubuntu shell — and every self-hostable service the app can run as a single container, such as n8n, Flowise, Langflow, Vaultwarden and Checkmk. Choosing one fills in its image, port, volumes and environment, all of which you can change. Services that need a docker-compose stack are installed from their own pane on this Mac instead, and the sheet names them so nothing looks missing.
| Field | What it does |
|---|---|
| Image | The image reference, with a menu of images already on the target. |
| Name | Optional, and checked against the names already in use there. |
| Published ports | Each has a This machine only switch that binds 127.0.0.1, so a port is not exposed to the network unless you say so. |
| Volumes | A plain name is a Docker-managed volume; a path starting with / is a folder on the target. |
| Environment | Any variable can be marked secret, so it is entered as a password and hidden from the preview. |
| Advanced | Restart policy, network, a command override, extra Docker arguments, and whether it runs in the background. |
Before anything happens the sheet shows the exact docker run line with secrets replaced by dots, and lets you copy it. Creating pulls the image first (unless you turn that off) and then runs it, streaming the output back into the sheet.
sudo docker when the SSH user is not in the docker group — the usual reason a first attempt on a fresh Linux box reports a permission error.8.17.2The Containers board as a monitor
The Containers pane is not only a list. It carries a status dot that rolls every runtime on this Mac into a single verdict, so a glance at the sidebar tells you whether anything needs attention. Green means everything installed is healthy; orange means something is stopped or still being probed; red means an installed engine is down, or a container is unhealthy, restarting, or exited with an error. A runtime you have never installed is not a fault — green therefore reads as “everything present is happy”, not “everything is running”.
The sections follow the same order as the services list: Apple Containers, Docker, Kubernetes, OrbStack, container machines, then Vagrant. Kubernetes appears here read-only, showing the clusters you pinned in Kubernetes Clusters; pinning and per-cluster actions stay in that pane, which watches whole clusters wherever they run rather than only what is on this Mac. Where a runtime is not installed, the button opens the pane that installs it instead of sending you to a download page.
The pin button in the header opens a small floating palette: a single status bar with the overall dot and a running count, above a short list of what is running, with anything set up but idle grouped under Waiting. It is deliberately tiny — something to leave in a corner of the screen while you work elsewhere. Clicking any row jumps the main window to it.
8.17.3Docker Swarm
Swarm is not a separate product to install — it is built into the Docker engine, which is why FrontierStack monitors it from the Docker pane rather than giving it a pane of its own. When the engine you are looking at belongs to a swarm, a Docker Swarm section appears listing the cluster's nodes (ready or down, whether one is draining, and which are managers) and its services with their replica counts — 3/3 when a service has every task it asked for, 1/3 when it does not. The Server Activity window's Docker tab carries the same thing as a Swarm segment, so you can read a cluster from any linked server.
The state comes from docker info, which the pane already calls for engine health, so a machine that is not in a swarm costs nothing extra to check. One rule of Swarm shapes what you see: only a manager may list the cluster. Ask a worker and its daemon refuses, so on a worker FrontierStack tells you that plainly rather than showing empty tables that look like a failure.
8.17.4Ready-made stacks
Some things are not one container but several that are useless apart. Install Stack…, on the Containers pane and in the Server Activity window's Docker tab, sets up a whole group at once. Four ship with the app: the *arr media stack (Prowlarr, which holds the indexer list the others read, plus Sonarr for series, Radarr for films, Lidarr for music, Readarr for books, Bazarr for subtitles and a download client), Monitoring (Prometheus, Grafana and node-exporter), a Media server (Jellyfin, optionally with Jellyseerr for requests) and Immich, a self-hosted photo library that genuinely needs four containers — server, machine learning, Redis and PostgreSQL.
You choose which members to include, where the config and media folders live, the user and group the containers write as, and a port offset that moves the whole stack clear of something already listening. Published ports bind to 127.0.0.1 unless you say otherwise. FrontierStack then writes a docker-compose.yml into the project folder and runs docker compose up -d. Compose is what makes a stack a stack: the members share a network and address each other by name, which is why Sonarr's indexer setting can simply be http://prowlarr:9696.
docker compose up -d again is the normal way to change a stack later — FrontierStack has not hidden anything from you.container CLI has no compose equivalent, and on a custom network it cannot yet resolve another container by a bare name, so the members could not find each other the way a stack needs.8.17.5Apple containers, and the GUI we recommend
On Apple silicon, macOS can run Linux containers natively through Apple's own container command, where each container gets its own lightweight virtual machine instead of sharing one big Linux VM. The Containers pane has an Apple Containers section for this: it lists what is running, starts and stops the container system, pulls images, and creates new containers, in the same shape as the Docker section above. Apple's tool is a command-line program, and FrontierStack installs it from its GitHub releases.
For day-to-day work with Apple containers we recommend Davit, an independent macOS app that puts a proper graphical front-end on that same container command — browsing containers and images, starting and stopping them and following logs, without having to remember subcommands. The Apple Containers section installs it for you through its Homebrew cask and opens it afterwards. Davit needs Apple silicon and macOS 15 or newer.
container CLI that FrontierStack drives, so the two always agree about what is running — but Apple's container must still be installed for either of them to have anything to talk to. Installing Davit on its own is not enough.8.6Remote Tools — per-node diagnostics
Fleet & Remote ▸ Remote Tools is a suite of SSH-driven diagnostics, distilled from real fleet-debugging work. Choose the target first — a pinned server, or Other (IP / host)… for an ad-hoc address that isn't a saved server (its sudo password persists in the Keychain too) — then the tool and its parameters. Read-only checks need no root; ones that read protected logs or config use the saved sudo password through the helper, and a few are marked mutating.
| Tool | Purpose |
|---|---|
| Ping · Traceroute · Whois | Basic reachability, path and registration lookups, run from the chosen node. |
| Net Info · Netstat | Interfaces and addresses; routing table, interface/protocol stats, active sockets. |
| Port Scan · Port Check · Web Check | Scan a range, test a single port, or fetch an HTTP/HTTPS endpoint and report the status. |
| TLS Inspect · TLS Expiry | Inspect a certificate; check expiry across selected nodes at once. |
| System Resources · Listening Ports | Load, memory and disk for the node; what's listening (optionally with sudo). |
| Tail Log · Config Test | Tail any log path; validate the web server's configuration. |
| File Diff · Healthcheck | Compare a file's contents across nodes (drift); hit a vhost's paths over loopback on each node. |
| rsync Deploy | Push a local folder to a remote path — with a dry-run preview and an optional --delete. |
| Security · SSH · Exposure · Auth · User audits | Read-only audits (see Chapter 10) on any node or ad-hoc IP. |
| Flush DNS · Restart Backend | Flush the resolver cache; kick the macOS Server web backend (mutating — sites blip). |
Some tools work across several selected nodes at once — File Diff, Healthcheck, TLS Expiry and Serving Path Diagnosis (who's up, which public IPs each node binds, per-process CPU saturation and stopped services, cross-checked against every pinned Cloudflare zone's origin IP) are fleet-wide by design — which is exactly how you confirm every web node is serving the same content with a valid certificate. The bottom of the pane also offers safe over-SSH editing of /etc/hosts (root, through the helper) and the SSH user's ~/.ssh/known_hosts, each backed up to .fsbak first.
8.7Recovering a wedged server — and a safe power reset without SSH
A server can stop answering SSH while its services keep running — overloaded, not down. FrontierStack shows this: when SSH is unreachable but a service port still answers (say MySQL on 3306), the server's dot turns orange, not red, and its pane reads "SSH is wedged, but the server is still serving" and lists what's answering, with the database's version banner. The machine is alive — only its management channel is stuck — so don't assume it's dead or blindly cut the power.
Try a normal Reboot first. After Reboot, the dot flashes while FrontierStack waits out a grace period and then polls, refreshing the instant the host returns — no need to keep pressing Refresh.
Make a power reset safe — without SSH. When a database is still answering, the pane shows a red-outlined EMERGENCY box, Prepare databases for a safe power reset. Each step runs over the database's own connection (no SSH), using the credentials saved in Database Health, top to bottom: Stop accepting writes (reads still work, reversible), Quiesce & flush to disk, then Clean-shutdown. After a clean shutdown a hard power-cycle is safe, because nothing dirty is left in memory to corrupt. Coverage differs by engine — MySQL, Redis and MongoDB can be cleanly stopped over their protocol; PostgreSQL can be quiesced and flushed but not stopped over SQL, so you flush then power-cycle. The clean-shutdown button is red and confirms first.
Power-cycle, then bring it back. The hardware power controls (SwitchBot plug, smart powerboard/PDU, KVM) each offer Shut Down Databases First in their confirmation, so you can flush and stop the databases before cutting power. And if the shutdown relieved the pressure and SSH recovers, a Start button starts the database again over SSH — so the ideal path is often: clean-shutdown the runaway database, let the box recover, and Start it, with no power-cycle at all.
8.8The Host Monitor (remote agent)
SSH diagnostics run on demand. For continuous visibility, install the Host Monitor — a tiny, read-only Go helper (fsagent) that lives on the server and reports its own health, with no per-cycle SSH. From a linked host's pane, choose to install it (or tick the box in Link a Server); over the existing key the app pushes the right binary for the host's OS and architecture, sets up the platform service (systemd, launchd or BSD rc.d), and pins its TLS certificate. The AI tool install_monitor does the same on request.
Once enrolled, the monitor streams live metrics: CPU, memory, per-mount disk, network interfaces up, detected services, firewall and fail2ban state — and on GPU hosts, per-GPU temperature and utilisation, so a mining or ML rig surfaces thermals. list_monitors reports the fleet's helpers, their versions and latest metrics. Crucially, the monitor keeps watching and can alert even when the Mac app is offline, notifying directly through its own channels and replaying anything it buffered when the app returns. Logs windows prefer the monitor too — it runs as root on the server, so it reads privileged logs without needing the sudo password at all.
An enrolled host's pane also keeps a Behavior & History chart — CPU, memory, disk and temperature at five-minute resolution for up to 30 days, against a learned baseline that flags unusual behaviour. Temperature uses its own degree-marked scale, so it remains readable beside percentage-based resource use. Vertical lines place incidents on the same timeline: a solid red line is a server reboot (derived from the reported uptime), a dashed orange line is a watchdog issue — a forced service restart, a database-corruption warning or a reboot escalation. If the OS crash reporter starts using CPU (a process crashing repeatedly), an orange Crashes curve joins the chart, so "MySQL was force-restarted twice last night and something was crash-looping" is visible at a glance.
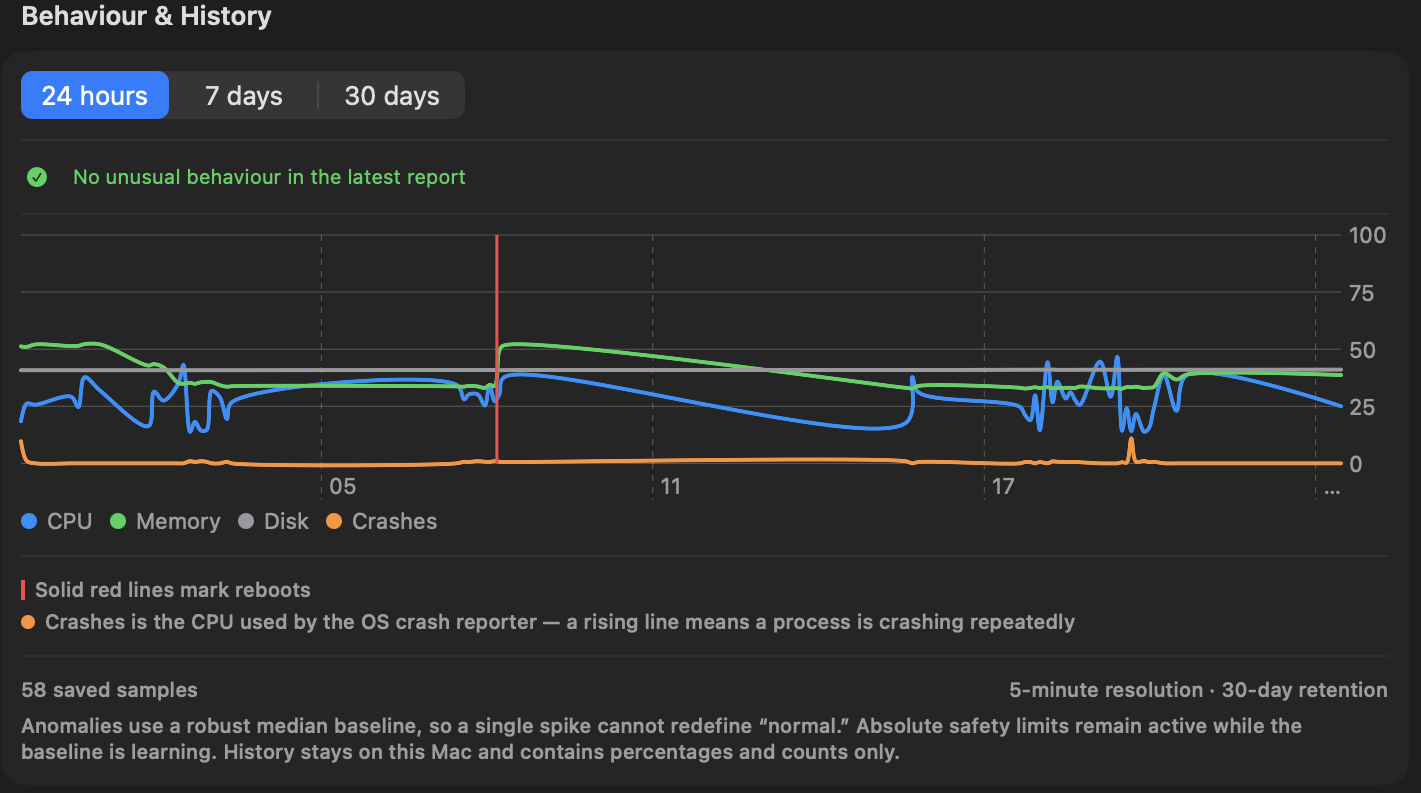
The monitor is read-only by default. Turning on Allow actions in its Host Monitor pane unlocks a small, fixed set of control verbs — never arbitrary shell — driven by the gated monitor_action tool: restart/reload/start/stop an allowlisted service, flush DNS, reload the firewall or fail2ban, or reboot. Each action is logged on the server. Targets cover Linux (amd64/arm64/arm — covering every Raspberry Pi), macOS (including legacy Intel builds back to OS X 10.11 El Capitan), FreeBSD (pfSense/OPNsense/TrueNAS) and Windows.
Keeping a monitor healthy over time is handled for you. Rotate monitor credential replaces its bearer credential in place: the new secret is generated on the Mac, sent over your approved FS1 signing key, and activated on the server without ever being shown or handed to an AI. With Allow self-update enabled, pushing a newer build is safe by construction — the candidate binary's release signature is verified, it must pass a compatibility self-test before it is given root, and the previous binary is kept as a rollback; if the new one fails to answer its health check, FrontierStack restores the old one automatically. Pull-mode updates fetch the binary through a short-lived, single-use grant rather than a durable token. When a monitor is verifying FS1-signed requests, its pane shows a FS1 signed badge.
8.9Cloud Servers, Server Clone & Remote Apache
Alongside the compute panes, AWS ▸ DynamoDB lists the tables in the selected region with their status, item count, size and partition/sort key. It leans on the two things that actually cost you: the capacity mode capsule separates provisioned tables — which bill for their read and write units continuously, whether or not anything touches them — from on-demand tables that bill per request; and a no PITR flag marks any table without point-in-time recovery, which is off by default on every new table and is the only way to rewind after a bad write. Point-in-time recovery can be switched on or off from each row's menu. DynamoDB has no bulk describe call, so each table is queried individually and the list is capped at 40 per region.
Fleet & Remote ▸ Cloud Servers rolls up one inventory across every cloud provider that has a configured API token — DigitalOcean, Vultr, Linode, Hetzner, Sakura, Contabo — plus AWS EC2, Lightsail and RDS. It is a read-only roll-up (power control stays in each provider's own pane). Each running instance with an IP offers a Services button to discover what's listening, and a + Helper button that links the instance over SSH and installs the monitor in one move — just set the right username and key in the sheet.
Server Clone is a guided wizard that stands a fleet server up to match this Mac: it installs the detected Homebrew stack, copies configs and site files to their original paths, pushes your domain configs and reloads the web server, and can clone MySQL databases (local mysqldump piped into mysql on the target over SSH). Every step runs over key-based SSH and is safe to re-run; existing data isn't deleted.
When a single site is ready to go live, the Promote to Production push (from a domain's context menu) sends its vhost config to the same path it uses locally, optionally copies the document root and database, points DNS at the target via Cloudflare, and can issue a real Let's Encrypt certificate with certbot — files, database, vhost, DNS and HTTPS in one push.
You can also manage a remote server's Apache directly. The Apache pane gains a host selector (This Mac / each linked server) when any remote host exists; pick a server and FrontierStack discovers its Apache over SSH — version, config layout, and every active vhost with its real log paths — and lets you edit vhosts, modules, MIME types, ports and WebDAV, with each change validated (httpd -t) and gracefully reloaded before it sticks, rolling back if the config is invalid. It even understands the legacy macOS Server.app Apache tree. From the Sites list, Push to Server… renders a local site's vhost onto a monitor-linked server with its document root swapped in. Chapter 7 covers the local Apache and Sites workflow these mirror.
8.10Screen sharing to a host
Each server's pane offers whatever remote-access method its probe detected — Apple Screen Sharing / VNC for a Mac, RDP for Windows, and AnyDesk, TeamViewer, RustDesk or NoMachine when their clients are present. When Apple Remote Desktop is installed on this Mac it registers the vnc:// handler and captures the click, so the pane offers a separate Screen Sharing (macOS) action that always opens Apple's built-in Screen Sharing client instead. If the host is reachable at more than one address — a LAN IP and a VPN or Tailscale address, say — that action becomes a menu so you pick which network to connect over; each choice dials the numeric IP directly, so it still works when the host's name isn't resolving (mDNS, split-horizon DNS, or a VPN quirk). A matching “— by IP” button appears for VNC and RDP whenever the pane would otherwise use a name that might not resolve.
8.11KVM-over-IP: console and power, lights-out
SSH and Screen Sharing need the machine to be up and on the network. When it isn't — a kernel panic, a BIOS/firmware screen, a network stack that never came up — you need out-of-band access: a KVM-over-IP appliance that captures the real HDMI output and injects USB keyboard/mouse, independent of the operating system. The Remote KVM pane registers as many of these as you own — PiKVM, JetKVM, TinyPilot, NanoKVM, GL.iNet Comet, or any generic unit — each pinnable, each one click from its web console down to the BIOS.
Units with power control close the loop. A PiKVM with an ATX board, a network PDU, or GL.iNet's Comet Pro (GL-RM10) — which is a KVM and a smart power plug in one device — can switch mains power, so you can hard power-cycle a truly frozen box. Link such a unit as a server's power source in its Power section (beside SwitchBot, UPS and PDU commands) for On/Off/Cycle. The AI Administrator can drive it too: list_kvms, kvm_power, and server_power — the last reaches a host's linked plug/PDU/KVM to restart a hung server that won't answer reboot_host.
8.12Boot Media: installing an operating system over the network
Reinstalling a server used to mean a trip to the rack with a USB stick. The Boot Media pane (Fleet & Remote) replaces the stick: you keep installer images in one library on this Mac, and FrontierStack presents the one you choose to the target machine as a virtual CD — through the server's management controller, a PiKVM, a Proxmox VE virtual machine's CD drive, or a network boot menu. Macs are handled differently, because Apple no longer lets them boot that way; see Macs below.
8.17.6The image library
Add ISO or Disk Image… records a local file; the file stays where it is and nothing is copied. Add Image URL… records an image that already lives on a web or file server (http, https, nfs or cifs) — a remote URL is handed straight to the target, so this Mac never has to carry the bytes. Compute SHA-256 records the file's checksum so you can compare it with the vendor's published one before installing anything from it. Each entry can be renamed, shown in Finder, removed from the library, or its served address copied with Copy Image URL. An entry whose file is no longer at its saved location is flagged as missing.
8.17.7The built-in media server
A management controller mounts an ISO by reading it over HTTP, piece by piece, for as long as the install runs. The pane's Media server serves the library's local images for exactly that: it supports byte-range requests and keep-alive, which virtual CDs need, and shows a log of recent requests and the bytes served per image, so you can see a controller actually reading. It starts automatically when a target needs a local image, or you can press Start Serving yourself.
| Setting | What it does |
|---|---|
| Stop serving after | 1, 3, 6, 12 or 24 hours, or Until I stop it. Every read restarts the clock, so a slow install is never cut off mid-way. Serving also stops when you quit FrontierStack. |
| Address in image URLs | Automatic uses the address this Mac uses to reach each target, so a controller on a separate management VLAN is given an address it can actually reach. Or choose one fixed address. |
| Port | 8742 by default. |
| Open Port… | Shown when pf or the Application Firewall is on and may block controllers. It opens the port after an administrator prompt. |
403. Each image is published at an unguessable 128-bit token URL, and only while serving is on. An installer ISO is not usually secret, but a customised image can contain keys or answer files, so leave the timer on rather than choosing Until I stop it on a shared network.8.17.8Server management controllers (Redfish)
Most rack servers carry a baseboard management controller that can present an image as a virtual CD. FrontierStack drives it through the standard DMTF Redfish API: Dell iDRAC 8 and 9, HPE iLO 4, 5 and 6, Lenovo XClarity Controller (XCC), Supermicro X12 and newer, and any other controller that implements standard Redfish virtual media.
- Add Controller and enter its address, port, username and password. The password is kept in the Keychain and sent only to the controller. Optionally link the controller to a fleet server so the two are shown together. Use an account with the Virtual Media and Control privileges.
- Read Controller discovers what it manages: each system with its model and power state, and each virtual CD slot with whatever is mounted in it now.
- Choose the System, the Virtual CD and the Image. Leave Boot from it once on to boot the CD a single time, after which the server returns to its normal boot order.
- Under Then, choose Don't restart, Graceful restart or Force restart, and press Mount (or Mount and Restart, which asks for confirmation first).
- When the install is done, Eject the virtual CD.
| Controller | Virtual media notes |
|---|---|
| Dell iDRAC 8 / 9 | Needs the Enterprise or Datacenter licence. |
| HPE iLO 4 / 5 / 6 | Needs iLO Advanced. |
| Lenovo XClarity (XCC) | Needs XCC Advanced or Enterprise. |
| Supermicro X12 and newer | Standard Redfish virtual media. X10 and X11 boards offer virtual media only in their own console, so mount the image there using a copied URL. |
| Other Redfish controllers | Anything that implements the standard VirtualMedia insert/eject actions. |
8.17.9PiKVM virtual media
A PiKVM can emulate a USB drive for the machine it is plugged into. Boot Media uses PiKVM's documented /api/msd interface, with the same PiKVM API account as its ATX power control (see KVM-over-IP). First copy an image to the PiKVM's own storage: a local file is streamed up with a progress bar, or the PiKVM downloads a remote URL itself. Free space is checked before the copy starts. Then connect a stored image As CD-ROM (for an ISO) or As Flash (for a raw .img), pick it in the machine's boot menu or use Power Cycle… (a hard ATX cycle, with confirmation), and open the console to follow the install. Disconnect Drive and delete tidy up afterwards.
8.17.10Proxmox VE virtual machines
For a virtual machine on Proxmox VE (connected as described in Proxmox VE below), choose the Node, the Virtual machine and the ISO storage, then the Source. Image from the library has Proxmox download the image into ISO storage itself (its download-url call), so a local image is fetched from this Mac's media server; ISO already on Proxmox uses one that is there. FrontierStack attaches the ISO to the VM's CD drive and can put the CD first in the boot order — the original order is remembered and restored when you eject. Finally choose to leave the VM as it is, start it, or reset it (a hard reset, which asks for confirmation).
The API token needs Datastore.AllocateTemplate and Sys.AccessNetwork for the download, and VM.Config.CDROM, VM.Config.Options and VM.PowerMgmt on the VM. The pane lists these beside the controls.
8.17.11Network boot (PXE / iPXE)
Machines with no controller and no KVM can still boot over the network. Turn on Serve an iPXE boot menu from this Mac and the media server also publishes an iPXE menu that SAN-boots any library ISO over HTTP, chains to netboot.xyz for its catalogue of installers, and offers an iPXE shell and boot from local disk. Download iPXE Boot Loaders fetches the official loaders from boot.ipxe.org (ipxe.efi, undionly.kpxe and the arm64 ipxe.efi) so UEFI HTTP Boot clients can load iPXE straight from this Mac.
What remains is telling your DHCP server where to send booting machines. Pick your DHCP server and press Copy Settings for a ready-made snippet:
| DHCP server | Use it when |
|---|---|
| dnsmasq | dnsmasq is your DHCP server; it also has a built-in TFTP server. |
| dnsmasq (proxy-DHCP) | Your router keeps handing out addresses and dnsmasq answers only the PXE clients. |
| ISC dhcpd · Kea | A Linux DHCP server you edit yourself. |
| OPNsense / pfSense | The firewall is your DHCP server; the snippet names its network-boot fields. |
| UEFI HTTP Boot (no TFTP) | The firmware downloads iPXE over HTTP from this Mac, with no TFTP at all. |
8.17.12Other KVM-over-IP units
JetKVM, GL.iNet Comet, NanoKVM, TinyPilot, Raritan, ATEN, Avocent, Lantronix and Adder units have no stable public API for virtual media, so FrontierStack does not pretend to drive it. Instead Copy URL starts serving and copies an image address the KVM can reach, and the pane shows where to paste it in that vendor's own console.
8.17.13Macs
A Mac cannot boot an installer ISO, and network boot is gone: Apple silicon has none, and Intel NetBoot lost its server in macOS Server 5.7 and is refused by T2 Macs at Full Security. So for Macs, Boot Media installs macOS the way Apple supports — by downloading Apple's full installer on the Mac itself over SSH and running it. Every remote Mac in the fleet gets a card (add Macs under Remote Servers first):
- Refresh reads its macOS version, whether it is Apple silicon, Intel or Intel with T2, the model, free space, the installers already present, and whether Content Caching is on.
- List asks Apple which full installers are available (
softwareupdate --list-full-installers); Download on the Mac fetches one in the background (--fetch-full-installer) with progress. - Install… runs
startosinstallin one of two modes: Upgrade / reinstall (keeps data) or Erase and install. On Apple silicon only a volume owner may start an install, so you enter an administrator user and their password; the password is passed tostartosinstallon standard input and never stored. - Turn On Content Caching (on this Mac or any fleet Mac) keeps a copy of Apple's updates and installers on the LAN, so every other Mac downloads them from there rather than from Apple.
- For an Intel Mac with a linked KVM, Internet Recovery… restarts it into Apple's own network recovery, after confirmation. Recovery has no Screen Sharing or SSH, which is why a KVM is required to drive it.
8.17.14From the AI Administrator
The AI Administrator and MCP clients reach Boot Media through the existing kvm tool: media_list (read-only) reports the library, the media server's state, each controller's power and mounted image, and each PiKVM's drive; media_attach mounts an image on a target — a controller or PiKVM by name, or proxmox:<vmid> — and with boot=true also restarts into it; media_eject removes it. Attaching, ejecting and restarting need Allow changes and always ask you to confirm (Chapter 13).
8.13Proxmox VE: live cluster status and guest power
A Proxmox VE host is a server full of servers, and SSH to the node alone does not tell you much about its guests. The Proxmox VE service page (Containers category; see Chapter 6) therefore talks to Proxmox's own API. Add Connection and enter a cluster or single node's address with an API token — the token ID in user@realm!name form and its secret, which is kept in the Keychain and sent only in the Authorization header. Proxmox's self-signed certificate is accepted only on a private address. A token with the PVEAuditor role is enough for status; power control and boot media need the extra permissions listed above.
Once connected, the page shows the cluster name, Proxmox version and quorum; for each node its CPU, memory, root disk and uptime; every VM and container with its state; and a usage bar for each storage. Each guest can be started, shut down or rebooted, and — after confirmation — hard-stopped or reset. Show in Server Activity and Boot an ISO… jump to the other two places Proxmox appears.
In the Server Activity window (Chapter 11) every node is a tile in the All Servers, Cluster and Everything layouts, with CPU, memory, disk and uptime sparklines and a line such as “5/7 VMs · 2/3 containers running”. A node's detail shows its KPIs, a CPU and memory chart, the guest list with the same power controls, its storage and the cluster facts, plus Open Web UI, Refresh and Boot an ISO….
Alerts watches each connection in the background, refreshing about every five minutes: API reachability, each node's online state, cluster quorum, and any storage more than 90% full. The AI Administrator has the same view through the kvm tool's proxmox_status action (read-only) and can change a guest's power with proxmox_power, which always asks for confirmation.
PVEAuditor is enough; add the VM and datastore permissions later if you decide to boot installers from here.8.14Old Macs, Raspberry Pis & Windows hosts
Part of the point of a fleet is keeping older or odd hardware useful. A vintage Xserve or Mac mini still running macOS Server links like any other host; the Remote Apache discovery understands Server.app's own Apache tree and its internal ports, so its websites show up and can be edited, and the legacy Intel builds of the monitor run as far back as OS X 10.11 El Capitan. A shelf of Raspberry Pis links as ordinary Linux boxes — the monitor's arm build covers every Pi including the Zero — so you watch their CPU, disk and services right alongside everything else.
Windows hosts join over Microsoft's OpenSSH server: link them like a Linux box for SSH diagnostics, and install the monitor as a native Windows Service (because Windows services don't reliably inherit machine environment, its config is read from a file beside the executable). Windows monitor installs are done manually with the supplied PowerShell installer from the Host Monitor pane, rather than auto-pushed.
For interactive control beyond diagnostics, the catalog also carries the remote-access tools — RustDesk, MeshCentral, Apache Guacamole, Windows Remote Desktop and WinRM — but those are services you run, not the SSH fleet itself. The fleet's strength is uniform, scriptable, low-overhead management of everything from one window — and, with Chapter 13's run_script targeting any node by name, an AI that can diagnose and fix a remote server two steps at a time: a read-only test, then a minimal fix, re-run to confirm.
8.15OpenCore Legacy Patcher Macs: is it safe to update?
Some of those older Intel Macs will be running a macOS newer than Apple ever shipped for them, courtesy of OpenCore Legacy Patcher (OCLP). That changes what a reboot means. An ordinary server Mac boots power → macOS → FrontierStack agent; an OCLP Mac boots power → firmware → EFI/OpenCore → macOS → OCLP root patches → FrontierStack. Every extra link is a place where an unattended boot can stop: a macOS update replaces the sealed system volume and takes the root patches with it (Wi-Fi, graphics acceleration and Bluetooth vanish until they are re-applied), a major upgrade needs a matching OCLP release first, and if the firmware's startup entry ever stops pointing at OpenCore the machine sits at a boot picker until someone holds Option and chooses “EFI Boot” — considerably more troublesome when that Mac is in another building.
The OpenCore Patcher pane (Fleet & Remote) exists so you know this before you press Update. Pick This Mac or a linked Mac and it runs a read-only probe — the OCLP app version, OpenCore's NVRAM stamp (only present when the Mac actually booted through OpenCore), the root-patch receipt, bless --getBoot, SIP, Software Update settings, the real model behind OpenCore's spoofed one — and turns it into a Remote boot safety list: firmware boot entry → OpenCore, default boot volume set, FileVault's effect on unattended reboot, root patches present and current, OCLP release supports the installed macOS (checked against the newest GitHub release), pending macOS update, automatic macOS installs off, and an EFI/OpenCore backup. Above it sits one verdict: Safe to update macOS, Update with caution, or Not safe, with the reasons.
The pane deliberately does not administer OCLP — building OpenCore and applying root patches stay in OCLP's own app. It offers three fixed, reversible admin actions: turn off automatic macOS installs (so System Settings never updates an OCLP Mac unattended), back up EFI (an archive of the EFI/OC folder kept on that Mac), and re-bless OpenCore (the same bless --setBoot OCLP's “Install to disk” runs, refused unless OpenCore.efi is really there). The fleet status probe also notices OCLP on every pinned Mac: the host row and the Server Activity window show it, and Alerts raises a Security item when root patches are missing or the boot entry bypasses OpenCore.
diagnose ["oclp"] returns the full report, and its scripts refuse to install a macOS update — or reboot a Mac whose boot entry bypasses OpenCore — until the pane's verdict is safe. So when you ask “why did Wi-Fi disappear after I updated this Mac?”, it reasons from OCLP = true, the real model, a recent update and root patches = missing, rather than from the diagnosis it would give an officially supported Mac.8.16Migration wizards: moving a stack onto a new device
Retiring an old server rarely means "reinstall everything by hand." FrontierStack ships guided migration wizards that lift a stack off a legacy machine and stand it up on a destination you choose — this Mac, another Mac, or a Linux box. The source is only ever read; everything is written to the target.
The Migrate Setups pane handles a MAMP, XAMPP or Apple Server.app web stack. It auto-detects the source, then lets you tick exactly what to carry: the Homebrew tools, web files, MySQL databases, the sites (vhosts), MIME overrides, Apache modules, PHP settings, WordPress wp-config.php fix-ups and Git repositories. A Set up on picker chooses the destination: leave it on This Mac for the full in-app migration, or pick a linked host to install the stack on that new device over SSH, copying the web files (rsync) and databases (dump over SSH) across — with a Linux toggle to use apt/dnf instead of Homebrew.
The pane's Servers section also has Import from a Repo…: point it at a folder or git repo that holds an SSH config, an Ansible inventory or .env files, and it adds the servers to your fleet and the credentials to Script Secrets or the matching service, after you review them. FrontierStack AI can read other layouts without ever seeing a value (Ch 13).
The Apple Server Migration pane is a one-click wizard for a whole Server.app machine. Point it at the source (this Mac or a remote one) and it inventories every service with serveradmin — Websites, Mail, Calendar and Contacts, Messages (XMPP), VPN, DNS, DHCP, NetInstall, Open Directory, File Sharing, Time Machine, Profile Manager and more — and anything else it finds running, such as a git server, databases, Docker or a standalone Nginx. Each service shows a status badge and a modern equivalent; where there's more than one sensible replacement (Calendar → Radicale / SOGo / Baïkal, VPN → WireGuard / strongSwan, DHCP → dnsmasq / Kea) you choose which one. Pick a target machine and OS, and the wizard installs the equivalents and prints a precise carry-over checklist. Services with dedicated importers — Websites (full vhost + file copy) and Open Directory (users and groups) — hand off to their own panes; a detected git server hands off to the Git Server migration.
serviceproxy, and on older releases — High Sierra especially — that process wedges: it carries on accepting connections but stops answering them. Ping succeeds, the port scans as open and SSH still works, so the sites look reachable while every one of them hangs. It is routinely misdiagnosed as a DNS or network fault for exactly that reason, and a plain “is the service running?” check will not catch it either, because the process never dies. Give the source machine a Service Guardian watch on http://127.0.0.1/ with service serviceproxy (use server-httpd to watch the backend behind it) so a wedge is spotted and healed with launchctl kickstart while you plan the move. Migrating the sites to a plain Apache removes the wedge-prone proxy from the serving path for good.serveradmin as root, so save that host's sudo password in its settings first (Chapter 8, "The managed key and the saved sudo password"). Some Apple services carry their config automatically (DNS zones, Apache vhosts, Postfix main.cf); others install the replacement and hand you the steps — the wizard labels each one Automatic, Assisted or Manual so there are no surprises.8.17The Git Server: Gitea & repository migration
The Git Server pane stands up a self-hosted Gitea (behind Caddy for automatic HTTPS) on any target — this Mac, a linked server, a NAS, a Docker host or a Linux box — detecting the platform and installing the right way. Once it's running, connect with an access token for a live monitor: version, repository count and backup-staleness alerting when a mirror falls behind its source.
The same pane migrates or mirrors another Git server into Gitea. Point it at on-disk bare repos — the legacy macOS app Simple Git Server, Xcode Server, Gitolite, a plain git-daemon, or any folder — or at a running remote server via any git://, https:// or ssh:// clone base (enumerate the repo names over SSH, or paste them). Scan lists the repositories; Migrate mirror-clones each one with full history, every branch and tag, and pushes it into Gitea, creating the destination repo through the API. The copy runs on this Mac.
Chapter 9
Networking & the Perimeter
See every device on your LAN, read your router's live state, and reach a service from the outside world — with or without opening a single port.
A Mac that runs services lives inside a network, and that network is where most real-world trouble starts: a router whose WAN link flapped, a forgotten device on the wrong subnet, a port you opened months ago and never closed. FrontierStack treats the network and its perimeter — the boundary between your LAN and the internet — as first-class objects. It reads your router directly, scans the LAN to build an inventory, draws a data-flow map, and gives you several disciplined ways to expose a service to the outside.
This chapter covers the network around your servers. For linking the servers themselves over SSH see Chapter 8; for the host firewall, fail2ban and the security audit see Chapter 10; and for Cloudflare DNS and TLS see Chapter 7.
9.1Routers & firewalls you can read and drive
FrontierStack talks to network gear through its own management API where one exists, and over SSH where it does not. The two tightest integrations are OPNsense (its full REST API) and Cloudflare (covered in Chapter 7); a wider set of routers and firewalls report live status. Add a device in the Router & Network pane with its address, vendor and API key, and the AI Administrator's router_info tool can then read its version and model, uptime, CPU and memory, WAN links and gateways (up or down), interfaces and client count — plus the raw API JSON for any field FrontierStack does not map. It is read-only: it queries the device's own API, never SSH.
| Device | How FrontierStack reaches it |
|---|---|
| OPNsense | Full REST API — live status, firewall rules, port-forward (rdr) for the perimeter |
| pfSense | REST via the API package |
| MikroTik RouterOS | REST API (RouterOS v7+) |
| Ubiquiti UniFi / EdgeOS | Controller / gateway API key |
| OpenWrt | LuCI / ubus API |
| DD-WRT | Web admin / SSH |
| ASUSWRT | Router web API / SSH |
| FRITZ!Box | TR-064 / web admin |
| TP-Link Omada | Controller API |
router_info still reports that it is pinned, where, and whether it is reachable — and tells you to add its API key in Router & Network to read version, gateways, WAN and interfaces live.For OPNsense and pfSense, an API key unlocks a continuous firewall monitor (the toggle in the pinned device's pane): every Alerts sweep polls the firewall itself for gateway state, interface carrier and service liveness — so a WAN line that dies while a multi-WAN router silently fails over (servers browse fine, inbound to your sites is dead) raises an alert naming the gateway and the port that lost carrier, instead of an unexplained sea of red site dots. Nothing is installed on the router: OPNsense's REST API is built in, and pfSense needs only its REST API v2 package. The same pane can also join an OPNsense router to your tailnet: sign in to Tailscale on your Mac (Google accounts work), mint a pre-auth key, paste it in the device pane's Tailscale section — FrontierStack installs the os-tailscale plugin if needed, saves the key and login server (Headscale too), and restarts the service over the API, no browser login on the router required. The tailnet address is then remembered as a fallback: when the LAN address stops answering (off-site, VPN route down, LAN leg dead), Check Status, the monitor and certificate renewal retry over Tailscale automatically and say so, and the monitor raises a separate "LAN address" alert so a routing fault is not mistaken for a dead router.
Attack and failure signals. The same sweep that watches gateways also watches for trouble on the router itself, and a router in distress turns orange with a warning triangle in the sidebar — hover for the reason. On OPNsense with the Intrusion Detection plugin enabled, FrontierStack reads its recent Suricata alerts over the same API and shows the count and top signature (an attempted attack surfaced without opening the firewall UI; pfSense's REST API does not expose IDS uniformly, so this is OPNsense-only for now). Across every monitored router — OPNsense, pfSense, OpenWrt and the rest — each sweep also flags an unexpected reboot (uptime dropped sharply: a crash, a power event, or an attack), a brute-force spike on the router's admin/SSH (repeated failed logins, with the busiest source IP named from the router's own log), resource stress (memory or load dangerously high — a DoS, a runaway or compromised process), and an available firmware update (outdated firmware means known holes). Each raises an alert; signals a given platform cannot report are simply skipped, never a false all-clear. OPNsense and OpenWrt report the most; pfSense's API is more limited.
Certificate expiry. The same sweep reads the firewall's trust store — every CA and certificate a service uses — and raises an alert a month before one expires, and again once it has. This is the failure nobody plans for: an OpenVPN server certificate issued on OPNsense's 397-day default quietly locks every remote user out a year later, and the Web GUI's own HTTPS certificate lapsing turns the admin page into a browser warning. The device pane lists them soonest-first with a coloured dot, and a Renew… button reissues a certificate in place through the router's API: same private key, subject and CA, a lifetime you choose (up to ten years), and optional restarts of the OpenVPN servers and the Web GUI so they load it. Because the key and subject are unchanged, existing VPN client profiles keep working — nothing to re-export. On pfSense the REST API's renew action does the equivalent and restarts dependent services itself, and because its API reports no expiry for certificate authorities FrontierStack reads that date out of the CA certificate itself, so a pfSense CA warns like any other. CAs cannot be renewed through either API; an expiring CA is announced early precisely because replacing it means re-signing certificates and redistributing client profiles. The OpenVPN service pane shows the same router certificates next to the CA and client certificate embedded in every .ovpn profile on the Mac (OpenVPN Connect, Tunnelblick, the last file used), so client and server expiry sit side by side; its Plan & Cost card also notes that OpenVPN itself is free and what Access Server and CloudConnexa charge.
Driving and diagnosing a router. The AI Administrator can now do more than read: reboot_router restarts an appliance the same way it reboots a server (OPNsense/pfSense via API, OpenWrt over SSH), gated behind "Allow changes"; and when a task is genuinely better done in the router's own console, the assistant offers to open its Web UI with open_web_ui, resolving the address from the device pane rather than guessing. FrontierStack itself deliberately does not edit these appliances' firewall rules — OPNsense/pfSense/OpenWrt manage rules through their own config system, so the pane and the assistant point you at the native firewall page instead (right-click a router ▸ Open firewall rules… deep-links it). Two pane conveniences round this out: a Diagnostics button runs an API-free reachability check (ping, the common admin ports 80/443/8443/53, reverse DNS, gateway) so you can triage a router even without an API key; and for a router or firewall, Discover Services offers to open the Web UI rather than port-scanning it (a scan of your own perimeter device is rarely what you want). If SSH to an OPNsense or pfSense box is refused, SSH is either disabled or — more often — only allowed on certain interfaces (commonly the LAN, not the WAN): reaching it over the LAN, e.g. through a VPN, usually works, while from outside it is typically blocked. Enable SSH and its listening interfaces in the web UI (System ▸ Settings ▸ Administration ▸ Secure Shell on OPNsense). The SSH button itself is only hidden for consumer gateways that have no admin shell at all (NTT, some TP-Link/FRITZ!Box), where the Web UI is the only way in.
9.2Firewall vitals, graphs and power
A pinned OPNsense, pfSense or OpenWrt firewall with monitoring switched on reports its own vitals through its API, and its pane now graphs them: CPU and memory on one 0–100 chart, load average, and temperature. The samples come from the monitoring poll that was already running, so the graphs cost no extra API calls and fill in as the Alerts sweep proceeds, covering roughly the last six hours of the session.
What each platform gives differs, and the pane shows only what is real: pfSense reports an instantaneous CPU percentage, while OPNsense reports load average instead. Temperature depends on the hardware exposing a sensor FreeBSD can read — many virtualised and ARM installs have none, so a missing figure means "no sensor", not a fault.
Any pinned device can also have a smart plug linked to it, exactly as servers do: On, Off, Power-cycle, and a live wattage reading where the plug meters it. This matters most for a firewall, because it is the one box you can never reach over SSH when it wedges — the network you would reach it over is the one it serves. Neither OPNsense nor pfSense reports its own power draw (FreeBSD exposes thermal sensors, not watts), so a metered plug is the only real power figure available for one. Power-cycling asks for confirmation and warns that every connection through the firewall drops; try the API reboot first.
9.3Device Discovery: an inventory of your LAN
Open Device Discovery and press Find Monitors (or pick a subnet first). FrontierStack sweeps the chosen /24 using every method available at once, so routers, access points, switches, NAS boxes (Synology, QNAP, ZimaCube/ZimaOS…), printers, cameras and other servers all surface:
- Ping / ARP — an ICMP sweep, with ARP/MAC giving each host's vendor; turn on TCP Probe to find hosts that filter ICMP.
- Bonjour (mDNS) and SSDP / UPnP — advertised services and their friendly names.
- SNMP and LLDP / CDP — add model, port and neighbour details when
net-snmpandlldpdare installed (buttons in the pane install them). - Windows service ports — a machine that filters ICMP is still found by probing its distinctive ports (RDP, WinRM, SMB and friends), so Windows PCs no longer hide from the sweep.
The scan also notes how each host can be reached. An AnyDesk badge appears when AnyDesk is running locally or answering on its default port 7070, and a Tailscale badge — green when the peer is online — is built from this Mac's own tailscale status, matching mesh peers to discovered devices (only endpoints, hostnames and OS are kept; login names are never retained). On a directly-connected LAN, the Macs and devices macOS already knows through Bonjour appear before the slower IP sweep, so the list fills in quickly. A device's detail view carries matching AnyDesk and Tailscale rows with an Open app shortcut.
The AI Administrator's discover_devices tool runs the same scan and auto-pins the devices whose type it can identify confidently. Anything ambiguous is listed back rather than guessed at, so the assistant can ask you what it is and then pin it with pin_device. A pinned (monitored) device appears in its type's sidebar section; double-click it to open its pane, or use Open Web UI, Discover Services, Reclassify or Remove from its row. If you already know an address, the Add a device by IP field probes and pins it directly — no full scan needed.
9.4Cameras from every maker
The Cameras pane is one status board for every camera FrontierStack knows about, whether or not it can show a picture. It gathers cameras found by Device Discovery (pinned, and found but not yet pinned), AV Feeds streams, SwitchBot cameras, Smart Life cameras and UniFi Protect cameras. With dozens of cameras, the counts at the top and the Offline filter are the quick answer: offline cameras sort first, and a stream whose address matches a pinned camera is shown on that camera's tile rather than twice. A Protect camera with the same MAC address as a pinned camera is shown on that camera's tile. The bell on each tile switches its offline alert, and Alert on All covers every camera that can be checked at once. Alerts go through the Alerts pane, so a contacts preset can page the technician for the site.
A camera counts as alive if it answers on RTSP (port 554), its web port (80) or ONVIF (2020). Cloud-only cameras such as Ring, Nest, Blink and Arlo show no status, because only their own app can reach them.
Tapo cameras from anywhere (unofficial). In Services ▸ Cameras ▸ Tapo Cameras, sign in with your TP-Link ID to see each Tapo camera's online / offline state even when the Mac is away from home, with offline alerts through Alerts. FrontierStack signs in the way the Tapo Android app does, because TP-Link offers no official API — so it can break when TP-Link changes its app, and using it may be against TP-Link's terms. Only status is read. Your password is never stored, a camera counts as offline only after two checks in a row, and if TP-Link's cloud can't be reached the camera shows Status unavailable, never offline. Pinned Tapo cameras keep a green dot off-LAN while the cloud says they are online; other Tapo devices and, with a second sign-in, Kasa devices can be watched too.
SD cards. For Tapo, Hikvision/Annke, Dahua/Amcrest/Lorex, Reolink and Axis cameras, each tile also shows the memory card as the camera itself reports it: SD ✓ 42% used, No SD card, Unformatted, SD card error, or SD — when it isn't known (hover for the reason). FrontierStack asks the camera's own local API, never a cloud, and only while the Mac is on the camera's network; away from it, the last result stays with its time. Checks run every 30 minutes, one camera at a time and at most once per 10 minutes per camera. Non-Tapo cameras use the login from their AV Feeds stream or one you enter in the camera's device pane. Tapo cameras need admin and your TP-Link account password, entered once under Tapo Cameras ▸ Local camera access; it stays in the Keychain and is never sent to TP-Link's cloud. If a camera refuses a login, FrontierStack stops asking it until you fix the login or press Retry, because cameras lock accounts after repeated failures. A camera that can't be reached or signed in to is never reported as having no card. SD alerts are opt-in; nearly full alerts are off by default because most cameras loop-record and are always close to full. eufy, WTW and Eseecloud cameras have no local storage API.
What each make needs:
| Make | What works | How to set it up |
|---|---|---|
| Anker eufy | RTSP on many models; no ONVIF and no public API | In the eufy Security app: camera ▸ Settings ▸ Storage ▸ NAS (RTSP). Set the username and password there (they are random by default) and copy the link, usually rtsp://user:pass@ip:554/live0. Choose Continuous recording: in Event mode, and on battery cameras, the stream exists only during an event, so an offline alert would be false. At most four viewers at once. |
| WTW (塚本無線) | RTSP and ONVIF on the PoE/IP line; nothing on the EAGLE Wi-Fi line | See below. |
| Eseecloud (EseeCloud / IP Pro apps) | RTSP on recorders, on the web port 80 | Turn on the RTSP server in the recorder's own Network menu, then use rtsp://user:pass@nvr-ip:80/ch0_0.264. Channels count from zero (ch0 is camera 1), and _1 is the sub stream. Many stand-alone Eseecloud Wi-Fi cameras have no RTSP at all. The default login is admin with a blank password. |
9.14.1WTW cameras and recorders
Older IP cameras. WTW's own 2018 IP camera manual gives rtsp://ip:554/live/0/main for the main stream and /live/0/sub for the sub stream. Port 554 is the default and can be changed. RTSP is turned on in the camera's web network settings. Current PoE/IP models and NV4-series recorders list RTSP and ONVIF in their specifications. If the path above doesn't connect, add the camera over ONVIF in an NVR app to find its URL.
EAGLE Wi-Fi line. These have no RTSP and no ONVIF. WTW's support site says so for one camera, and the recorder specification lists only TCP/IP, DHCP and P2P. For these, the most you can do is check that the recorder answers on its web port: pin it in Device Discovery as WTW Camera / NVR and turn on its offline alert.
Default passwords. NV4 recorders use 00000000, which becomes wtwjapan after a factory reset. Older cameras use admin with a blank password, or admin/admin. Change them before the device goes on your network.
9.14.2Smart-home clouds
Smart Life (Tuya) devices are read through Tuya's official Cloud API. Create a Cloud project at iot.tuya.com in your account's data center (Japanese accounts use Western America), link your Smart Life account with Devices ▸ Link Tuya App Account, and paste the project's Access ID and Secret into the Smart Life pane. You then see every device's online state and plug power, can switch plugs and lights, and can have any device alert when it goes offline. The free trial allows about 26,000 calls a month and must be extended every few months, so FrontierStack checks every 10 minutes.
Minut sensors report noise, occupancy, temperature and humidity in rentals. The Minut pane alerts when a sensor goes offline, when its battery runs low, and when a home has a noise disturbance in progress. Minut opens its API only to accounts it has approved; its help article ties this to the Enterprise plan.
SmartThings, Govee, LIFX, Sensibo and Nuki each have their own pane that lists the account's devices with a status dot: green online, red offline, grey when the cloud didn't say. Turn on the bell next to a device, or Alert on all, to get an alert when it goes offline. Govee, LIFX, Sensibo and Nuki need only an API key or token from the vendor's app or website. For SmartThings, create your own OAuth app once with the SmartThings CLI so sign-in keeps working. A personal access token also works, but it expires after 24 hours. If a key is rejected or a sign-in expires, you get one account alert. If a cloud can't be reached, its devices are left unknown. Neither case is reported as devices going offline. Nuki locks are worth watching in rentals: a lock that has lost its connection can't be opened remotely for guests.
9.5The Data Map
The Data Map pane draws a per-location data-flow diagram: where your data lives and how it moves across the devices and services at one site. FrontierStack serialises the location's inventory — the discovered devices, their roles, and (optionally) scanned ports — scrubs it of secrets, and hands it to your subscription Claude through the local claude CLI (not the metered API the in-app harness uses). The reply comes back as a Mermaid flowchart plus a short narrative, rendered offline in the pane; the last diagram for each location is kept, and you can save it to your Obsidian vault as a runbook. Locations themselves are explained in Chapter 8.
9.6Opening a port: UPnP and NAT-PMP/PCP
To reach a service from the internet the classic way, a port on the router has to forward to your Mac. Rather than make you log into the router by hand, FrontierStack can ask the router for a mapping using the standard protocols it advertises:
- UPnP IGD (via
miniupnpc) — the common consumer-router method. - NAT-PMP / PCP (via
libnatpmp) — Apple's and the modern equivalent. - OPNsense — a perimeter rule and port-forward through its API directly.
These tools are installed on demand the first time you use them. A mapping made for a temporary session (see Debug Share) is torn down automatically when the session ends.
9.7Dynamic DNS: following a changing IP
Home and small-office connections rarely have a static IP, so a hostname you point at today's address goes stale tomorrow. The Dynamic DNS pane keeps a hostname tracking your current public IP. Add an entry with a Name, a Hostname (for example myhost.duckdns.org) and the account data for your provider; press Update Now to publish immediately, or turn on Update automatically. You choose whether the updater runs only while FrontierStack is running or permanently as a system service, so the record stays current even when the app is closed. Cloudflare users get a tighter path: a Cloudflare DDNS A record that follows your public IP, driven by the same Cloudflare integration as Chapter 7; a generic interval-based updater covers other providers via an update URL.
9.8Tunnels and mesh: reaching in without opening up
The better way to reach a service from outside is to skip inbound ports entirely. A tunnel makes an outbound connection that an outside endpoint rides back in on, traversing NAT with nothing forwarded:
- Cloudflare Tunnel — a Quick Tunnel gives you a public
*.trycloudflare.comURL with no account, or a named tunnel for a permanent hostname. - Tailscale — Serve keeps a service private inside your tailnet; Funnel publishes it to the internet through your Tailscale node.
For ongoing connectivity between machines, a mesh or VPN network gives every node a stable private address wherever it roams. FrontierStack manages the common ones — by API on a router that supports it (OPNsense), or over SSH on a server:
| Network | What it is |
|---|---|
| WireGuard | Modern, fast kernel VPN tunnels — the base layer most of the rest build on |
| Tailscale | WireGuard mesh with exit nodes and subnet routers, set up over SSH or the OPNsense API; the VPN pane can also bring Tailscale up automatically at every FrontierStack launch, so router fallback addresses and tailnet monitors work from the first sweep |
| Headscale | Self-hosted, open-source Tailscale control server |
| NetBird | Open-source zero-trust networking, self-hostable |
| Nebula | Lightweight overlay mesh (Slack / Defined Networking) |
| ZeroTier | Zero-trust SD-WAN / virtual networks — agent plus API |
9.14.3Tailnet: the whole-network view of Tailscale
The per-server Tailscale controls live inside each server's own pane and work over SSH: they answer “is the daemon up on this box”. The Tailnet pane answers the questions that span the whole network, which only Tailscale's own API can: paste an API access token (device read is enough — the pane never writes) and it lists every device with its addresses, OS, client version, owner, tags and last-seen time.
What earns the pane its place is the Needs attention list. It surfaces node keys that are about to expire — a scheduled outage, because when a key lapses the device silently drops off the tailnet until somebody re-authenticates it — devices waiting for approval, devices advertising routes nobody approved (the usual reason a subnet is unreachable even though the node is plainly up), and devices that stopped checking in weeks ago. Key expiry and pending approvals also raise Alerts.
9.14.4Running your own ZeroTier controller
ZeroTier's client is only the member side; networks are normally administered at my.zerotier.com. But every zerotier-one install can also be the controller for its own networks — fully self-hosted, no third party holding your membership list — and that path ships with no local administration UI at all. The ZeroTier Controller pane is that missing interface.
It shows the controller's identity and the networks it owns, and works the member-authorisation queue with one-click authorise/deauthorise. Members authorised but unseen for a fortnight are flagged, because an unused grant is a standing hole in the network. You can edit a network's name, privacy, routes and IP assignment pool, and write flow rules in ZeroTier's own rules language — compiled locally as you type, with templates for the common cases and a warning before you save a rule set that would lock everybody out.
Everything runs over SSH against the controller's own loopback API. The controller listens on 127.0.0.1:9993 and authenticates from a root-readable token, so FrontierStack never needs — and actively discourages — a publicly reachable controller API; the built-in audit flags it if one has been exposed anyway, along with loose file permissions and a missing backup. There is also a Prometheus export, a warm-standby backup/restore, and an assistant for migrating networks out of ZeroTier Central.
identity.secret irreplaceable: lose it and every network ID it owns is orphaned. Back it up encrypted, off the box.9.9UniFi: Cloud Gateways, Dream Machines and Superlink
Ubiquiti's consoles get their own pane, because a UniFi gateway is doing more than a generic router probe can see. It covers the console families alike — a Dream Machine (UDM, UDM Pro, UDM SE), a Cloud Gateway (UCG-Ultra, UCG-Max, UXG), a Superlink gateway, a Cloud Key or a self-hosted controller. The UniFi pane speaks both of Ubiquiti's APIs, and they answer different questions. A Site Manager key — one key, created at unifi.ui.com — lists every console on your account with its model, firmware and online state. That is the only way to learn a remote site has lost power or its internet connection, because a console that is off the network cannot tell you anything locally. A local console key, created on the console itself under Settings ▸ Admins & Users, unlocks what the gateway is doing right now.
Locally the pane shows WAN links with their ISP, latency and throughput, and marks which link is actually carrying traffic. That last detail matters: when a primary line drops, UniFi fails over silently to the backup, which is usually slower and often metered, and the normal way people discover this is the following month's bill. It also lists adopted devices and their firmware, firewall rules in the order the gateway evaluates them, the client list, and every port forward. Each enabled forward is a deliberate hole through the firewall, so the pane flags the ones that accept connections from any source address — correct for a public web server, worth a second look for anything else.
Alerts cover a console dropping offline, a WAN link going down, running on the backup link, a device leaving the network, and internet-exposed port forwards. The pane is deliberately read-only: rule and network changes stay in the UniFi console, where their validation lives. PoE switch ports are handled in the next section, and plain console reachability still appears in Router & Network alongside the other vendors.
The Site Manager key also lists UniFi Protect cameras and doorbells, read at most every five minutes. Tick Alert on a camera, or Alert on all Protect cameras, for offline alerts. A camera that is updating, or whose console is itself offline, is shown as unknown rather than down.
9.10Power over Ethernet: the power button for devices that have none
Access points, cameras, door controllers and desk phones have no power switch. Their only supply is the switch port they are plugged into, which means the recovery move for a wedged one — power-cycle it — normally involves a vendor web UI, or a walk to the cabinet.
The Power over Ethernet pane makes the port the button. Add a managed switch by IP and you get, per port: its PoE state (delivering power, searching, fault), powered-device class, priority and wattage where the switch reports it — plus power off/on and a proper power cycle. It also shows the switch's power budget: total watts, watts in use, and a warning when you cross the switch's own usage threshold, past which it starts shedding low priority ports — so port priority is editable here too.
This works broadly because PoE is standardised: RFC 3621's POWER-ETHERNET-MIB is implemented by essentially every managed PoE switch — Cisco, Aruba/HPE, Netgear, TP-Link/Omada, Ubiquiti, MikroTik, D-Link, Zyxel. Reading uses the SNMPv2c or SNMPv3 profile from Device Discovery. With SNMPv2c, switching a port needs a separate read-write community, added per switch and kept in your Keychain. With SNMPv3, it uses the authenticated profile only when that user has write permission on the switch. Cutting power deserves deliberate access and confirmation; FrontierStack does not expose arbitrary OID writes. With Monitor on, a port in fault state or a switch over its power budget raises an Alert — both otherwise stay invisible until someone notices a camera has gone dark.
9.11Internet Health and speed tests
The Internet Health pane is your view of the link itself. It continuously pings a list of Targets — Cloudflare's 1.1.1.1, Google and Quad9 DNS, two AWS regions and Tailscale's coordination server by default — showing latency and packet loss and re-testing every 30 seconds; hosts that block ICMP fall back to a TCP-connect latency on :443. The gear button in the Internet section's header opens the target-editing dialog — set the list up once and it stays out of the way. The same section carries an IPv6 verdict: each sweep checks whether a global IPv6 address is assigned, whether IPv6 traffic actually works (ping to Cloudflare/Google v6 anycast), and whether the network's advertised IPv6 DNS servers answer. The state it warns about loudest is advertised-but-broken IPv6 — the router hands out an address and an IPv6 DNS server, connections try IPv6 first, and everything stalls until IPv4 fallback; the pane says so in plain words, names the dead DNS server, and points at the router. The AI Administrator can run the same diagnosis with internet_speed (check=ipv6) and dig deeper with ping6/dig/scutil through its diagnose tool. The sidebar's Internet Health row carries a status dot fed by a light background sweep (at launch, then every 5 minutes): green when healthy, orange for broken IPv6 or heavy packet loss, red when every target is unreachable. Live Traffic graphs real-time throughput across every active interface; Addresses & Networks lists each interface, its subnet (a network you can reach directly) and the gateway. A built-in traceroute shows the ISP and transit providers your traffic crosses. Press Test Now in the Speed Test section — or ask the AI with internet_speed — to measure download, upload, latency and responsiveness, using the Ookla speedtest CLI if installed and Apple's networkQuality otherwise. While it runs, two speedtest.net-style dials show the download and upload live — needle, phase and the current Mbps — fed by Ookla's streaming output (the built-in networkQuality reports only at the end, so its dials wait), and the pane names the test server it connected to (provider and city), during the run and in the result. A test that fails now says why instead of ending silently. A Mac on Wi-Fi, though, measures its Wi-Fi as much as its ISP — so the same section can run the test from your router or a wired server instead: pick it under From Router / Server and FrontierStack runs the probe on that device over SSH (key authentication; routers as root), preferring an installed Ookla/speedtest-cli and falling back to a curl single-stream estimate. If the router measures much faster than the Mac, your bottleneck is the wireless hop, not the line — and the AI can do the same comparison via internet_speed with a source.
9.12Network Path: switches, hubs and hop-by-hop latency
The Network Path pane answers the physical question the IP tools cannot: which boxes does this connection actually cross, and which one slows it down? LAN Path reads your managed switches' bridge tables and LLDP neighbours over SNMP and draws the chain between this Mac and any LAN device — each link labelled with its port and speed, the slowest link flagged, and a dashed inferred box drawn where several devices share one switch port (the classic hidden unmanaged switch or hub, which cannot be queried directly). Locate a Device tracks one machine down: IP, MAC, maker (from the MAC prefix), type — and the exact switch port it is plugged into. Visual Traceroute charts each hop's round-trip time and highlights the hop that adds the most latency, so “is it my Wi-Fi, the ISP's first mile, or further out?” becomes a picture. Reading the switches uses the SNMPv2c or SNMPv3 profile set in Device Discovery; unmanaged gear stays invisible by nature, which is exactly what the inference is for. The pane fills itself in: on open it automatically maps the devices between this Mac and the router (and Map Mac → Router re-runs it). Device Link Speeds goes wider still — it surveys the negotiated Ethernet port speed of every known device from its switch port (both ends of a link negotiate the same rate), slowest and half-duplex links first: a NAS stuck at 100 Mbps on a gigabit network is usually a bad cable, an old unmanaged switch, or a mis-negotiating NIC, and this is where it shows up. Locate a Device also asks the device itself over SNMP what its ports negotiate, when it runs an agent.
9.13Debug Share: expose a localhost server, briefly
When you need to show a colleague or a phone a dev server running on localhost, the Debug Share pane exposes it for a session and then closes itself. Enter the port (or press Scan localhost to find a running server), choose how to Expose via, set an Auto-close time, and press Open debug session. Every share also closes automatically when FrontierStack quits.
| Method | Reach |
|---|---|
| Cloudflare Quick Tunnel | Public *.trycloudflare.com URL, no account — ideal for a quick client or phone preview |
| Tailscale Serve | Private — reachable only inside your tailnet |
| Tailscale Funnel | Public, through your Tailscale node (Funnel must be enabled in the tailnet) |
| LAN forwarder | A 0.0.0.0:<auto> → 127.0.0.1:port bridge so other machines on this LAN can reach a loopback-only server |
The LAN forwarder has two extras. If the host firewall is on, the pane shows Open port in firewall to allow that port in the pf rules just for the session. And an Outside access picker can map a WAN port via UPnP, NAT-PMP or the OPNsense API and pair it with a DDNS host, so a LAN share becomes reachable from the public internet — the mapping is removed when the share closes. The AI Administrator can open, list and close sessions too (debug_share_open / _list / _close), including over MCP when "Allow changes" is on.
A Debug Share session is meant to be brief. To keep your own dev server reachable from your tailnet with no timer, turn on Also serve on Tailscale for it in the Localhost pane (Chapter 4): it answers on this Mac’s Tailscale address on the same port, stays off the LAN, and closes when the server stops. The AI Administrator can start a folder that way with debug_share action serve and report the address to open.
9.14Named tunnels: a permanent public hostname
A Quick Tunnel is deliberately throwaway. When you want a service on this Mac to be reachable permanently at a real address — a self-hosted app, an internal dashboard, a webhook receiver — use a named tunnel instead. It gives the service a stable hostname on one of your own Cloudflare zones (say app.example.com), survives reboots, and — like every tunnel — opens no inbound port: the Mac dials out to Cloudflare's edge, so there is nothing to forward and nothing for a port scan to find.
Create one in the Cloudflare pane's Named Tunnels section: New Tunnel…, then a hostname under one of your zones and the local port it fronts. FrontierStack drives the whole setup through the Cloudflare API using the token you already hold — it creates the tunnel, writes its ingress rule (hostname → http://localhost:PORT), adds a proxied CNAME pointing the hostname at <id>.cfargotunnel.com, and then installs the persistent daemon with cloudflared service install. That last step needs a one-time admin prompt (it writes a LaunchDaemon under /Library); cloudflared itself is fetched from Homebrew on first use. Untick Run on this Mac now if you only want the tunnel and DNS created, to run cloudflared on some other host. Delete unwinds all of it — daemon, DNS record and the account-side tunnel. The AI Administrator has the same three verbs (tunnel_create / tunnel_list / tunnel_delete), with creating one gated behind a red confirmation because it publishes a service to the internet.
cloudflared service install runs a single system daemon per Mac, so one named tunnel runs locally at a time. You can still create and route additional named tunnels through the app and run their cloudflared connectors on other machines — the account, the hostname and the DNS are all set up either way.Chapter 10
Security & Hardening
The perimeter is only half the job. This chapter is about closing the doors you are not using, watching the ones you are, and proving who is allowed through them.
A server is most exposed not when something attacks it, but when it quietly drifts: a firewall left open, a password login no one disabled, a certificate that expired last week, a mail server that will relay for anyone. FrontierStack treats hardening as a continuous, observable state rather than a one-time checklist. The Security pane is your console for the host in front of you; the AI Administrator (Chapter 13) carries the same checks across your whole fleet over SSH. Everything here is read-only until you ask for a change, and every change is one you could make by hand.
10.1The firewall: Application Firewall and pf
macOS ships two firewalls and FrontierStack reads both. The Application Firewall (ALF) is the per-app layer you set in System Settings; the Security pane reports its state — enabled, stealth mode, block-all-incoming, and how many app rules exist — so you can confirm at a glance that it is on. The pf packet filter is the lower, port-level layer, and this is the one FrontierStack manages directly.
App-managed pf rules live in their own file, ~/Library/Application Support/FrontierStack/pf-frontierstack.conf, loaded into a dedicated frontierstack anchor that is wired idempotently into the system /etc/pf.conf. Keeping rules in their own anchor means FrontierStack never edits Apple's base ruleset and your rules survive a reload without trampling anything. Adding or removing a rule reloads pf through an authenticated admin prompt.
From the AI side, the firewall_rule tool adds or removes a single allow/deny rule for a port, optionally scoped to a source address. It detects the target's operating system first: This Mac and remote macOS hosts get pf (the frontierstack anchor); Linux servers get ufw. It never sends a ufw command to a Mac or a pf rule to Linux.
ufw on a server you only reach over the network, confirm the rule allows your management path, and keep a second way in (console, KVM-over-IP, Headless Setup's Screen Sharing).10.2Intrusion prevention and the open-ports watch
An open port that has to stay open still needs a guard. The Security pane integrates two intrusion-prevention engines. fail2ban bans IP addresses that match abusive log patterns — SSH and Apache brute force are the classic cases; the pane shows whether it is installed and running, its jail count and how many addresses are currently banned, with a one-click Reload and a "write a starter jail.local" action that drops in a sane SSH jail without overwriting your overrides. CrowdSec adds a shared reputation network on top, showing its active decision count and a Metrics button. Both run as root services installed via Homebrew.
The Open Ports section lists every listener on the host. A companion watch — remote-control and screen-sharing exposure — specifically flags VNC/Screen Sharing (:5900), Apple Remote Desktop, AnyDesk, TeamViewer, Chrome Remote Desktop, Splashtop, RustDesk and Tailscale exit-node advertising, and turns red when someone is connected right now. The Recent Intrusions and Active Bans sections aggregate detections from fail2ban.log, CrowdSec, Suricata's eve.json and Wazuh's alerts.json, newest first; sources you do not run are simply skipped. A new ban, a new listener or an active inbound session can each raise an alert — configure delivery in Chapter 11. The same section checks FileVault on this Mac, judged by what the Mac holds: if it is off while the Mac has SSH access to linked servers or the app-managed SSH key, the row turns red and an alert is raised, because a lost or stolen laptop would give up the keys to your whole fleet. A Mac with no fleet credentials is left alone.
10.3SSH hardening
SSH is the single most valuable door on most servers, so the Security pane includes an SSH Hardening Audit. It reads the effective configuration with sshd -T — not just the file on disk, but what the daemon actually applies after its drop-ins — and flags the settings that matter: PermitRootLogin, PasswordAuthentication, and the rest. When SSH is reachable from the network the pane says so plainly, because that is exactly where the findings matter.
The baseline for an internet-facing host is key-based authentication with PasswordAuthentication no. Apply fixes by editing /etc/ssh/sshd_config.d/ rather than the main file, so package updates leave your hardening intact. FrontierStack's own fleet channel already follows these rules: it uses Ed25519 keys, BatchMode=yes, IdentitiesOnly=yes and host-key trust-on-first-use recorded in known_hosts (Chapter 8). If a host's key access breaks, the repair_ssh_access tool reinstalls the managed key using a one-time login password held in your local vault — the password is read on your Mac and never sent to the AI.
10.4Server Security: the posture check for a remote host
Everything above describes the Security pane for this Mac. The Server Security pane is its counterpart for a linked server: the same posture check, read over SSH, for any host in your fleet. Open a server's detail and click Check… beside Security, or open the pane directly and pick a server from the host menu. A single scan reports the SSH hardening that matters (PermitRootLogin, PasswordAuthentication, the listening port), whether a firewall is present and enabled (ufw, firewalld, nftables or raw iptables), the intrusion-prevention engines running (fail2ban, CrowdSec), the count of pending security updates (apt, dnf, yum), every service listening on all interfaces, and host-integrity smells — world-writable directories missing the sticky bit, unexpected SUID binaries.
Each finding is scored High · Warning · Info · OK and rolled up into a one-line summary badge, so you can sweep a fleet and see at a glance which host needs attention. The pane never changes anything: a Fix it link takes you to the pane that actually makes the change — the Server Firewall pane to enable a firewall or edit rules, the Remote Tools SSH-hardening review, or the security tools that install fail2ban/CrowdSec. It reads deepest as root or with password-less sudo; without either it runs what it can and tells you so. Cross-links run both ways: the local Security pane links to macOS Firewall, Server Security links to Server Firewall, and a pinned server's panes link to both.
10.5The Malware Audit pane
The Malware Audit pane is a defender's dashboard for a single Mac, built in sections from the cheap, always-on checks down to the heavy forensics.
| Section | What it checks |
|---|---|
| Protections | Apple's own layers — Gatekeeper (blocks unsigned apps), SIP (System Integrity Protection), FileVault, and XProtect / XProtect Remediator, which scan and remove known malware automatically. Re-check refreshes them. |
| Persistence & Autoruns | Third-party LaunchAgents and LaunchDaemons — the classic macOS persistence spot. Unsigned items show in orange so you can confirm you installed each one; Apple-signed items are normal. |
| ClamAV On-Demand Scan | Signature-based antivirus. Point it at a path, Scan, and read the list of infected files. Run Update Signatures (freshclam) before the first scan. Read-only: it reports, it never deletes or quarantines. |
| YARA Rule Scan | Rule-based classification against IOCs and malware families, using YARA-X (yr) or classic YARA. Pair it with rules from your threat-intel feeds. |
| File Reputation | Computes a file's SHA-256 and opens its VirusTotal report (70+ engines, no API key). The file itself is never uploaded — only its hash. |
The same on-demand ClamAV scan is mirrored in the Security pane, and the AI's malware_scan tool runs ClamAV and/or YARA against any path on request — equally read-only.
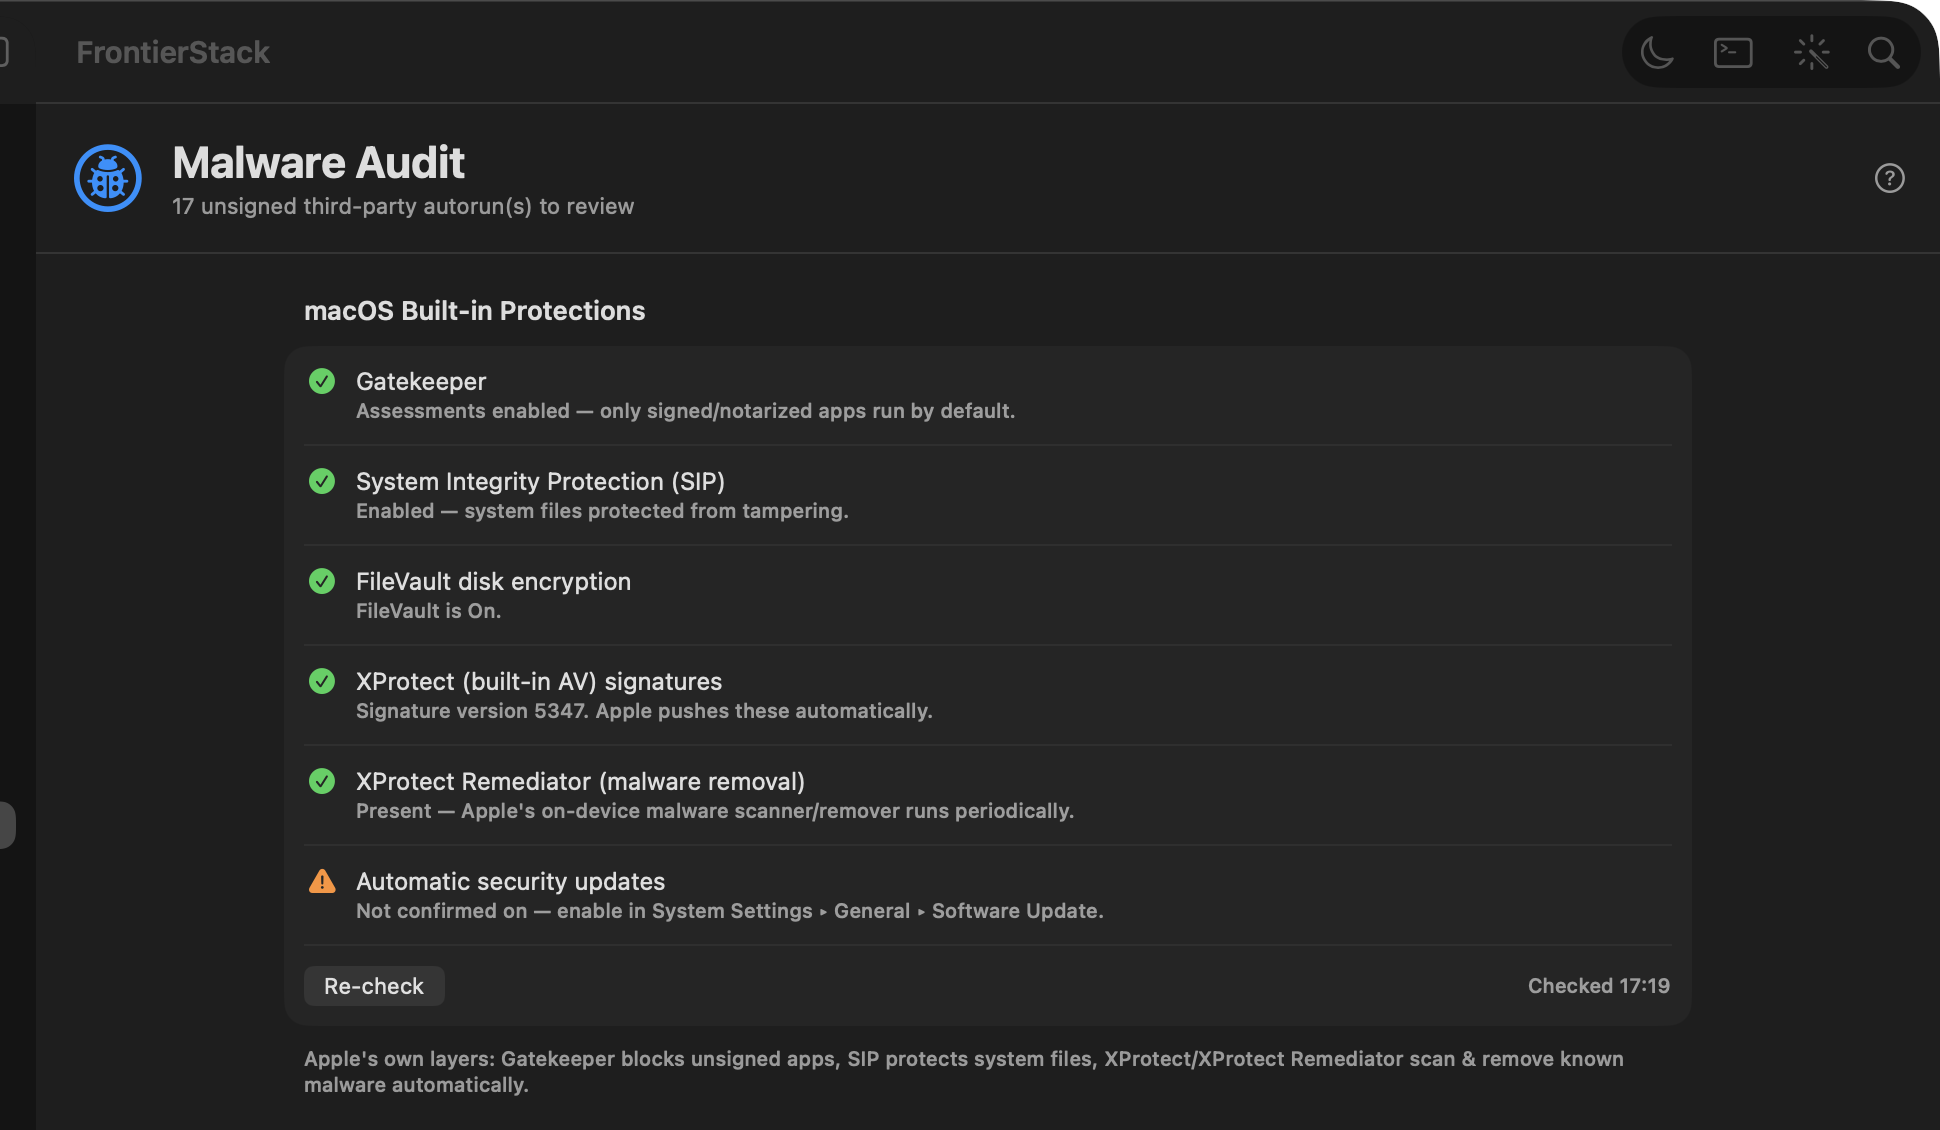
10.6Deeper forensics tooling
When a quick scan is not enough, the heavier analysis lives as installable services in the Security Tools catalog category — reveal them with the catalog filter (Chapter 6). Volatility 3 is a memory-forensics framework for examining a RAM capture; capa identifies the capabilities hidden inside an executable; the CAPE and Cuckoo sandboxes detonate a suspicious sample in isolation and extract its configuration and behaviour. Threat-intel services such as URLhaus, OpenPhish and OpenCTI feed your YARA and sandbox rules. SIEM platforms such as Wazuh have their own SIEM & Security Data section, described below.
10.7The EDR Fleet board
If your endpoints already run a commercial EDR agent, the EDR Fleet pane gives you one read-only roll-up across every console. Choose Add Console…, pick a provider and paste its API credentials — stored in the Keychain, never in the AI's view. Endpoint and open-detection counts are pulled from each vendor's REST API for SentinelOne, Huntress, CrowdStrike, Sophos Central, Bitdefender GravityZone and Microsoft Defender for Endpoint; Jamf Protect and LimaCharlie connect for reachability, and any other console can be added as Generic (reachability only). A Fleet totals row sums the lot. The board refreshes every few minutes; a console going unreachable raises an alert under the Security group, with its open-detection count riding along in the alert detail. Open Console jumps you to the vendor's own dashboard for the deep work.
10.8SIEM & Security Data
The SIEM & Security Data sidebar section separates a security-operations workflow that used to be scattered between Security Tools and Logging. Its SIEM Overview answers the first fleet question: which security platforms and data paths does FrontierStack know about, and are their watched management endpoints reachable? A row becomes configured only when the app has concrete evidence — a saved API credential, a detected local install, or a remote endpoint watch. A saved key is labelled Credentials saved, not Connected; a TCP response is labelled Reachable, not Healthy. This distinction prevents a listening but broken or unrelated service from receiving a false green status.
The section has two layers:
- SIEM platforms — Wazuh, Security Onion, Splunk, Elastic Security, Microsoft Sentinel, Google Security Operations, Graylog, IBM QRadar, Sumo Logic Cloud SIEM, Rapid7 InsightIDR, LogRhythm, Devo, FortiSIEM and OpenText ArcSight.
- Security-data pipelines — VirtualMetric DataStream, Cribl Stream, Logstash, Vector, Fluent Bit, Fluentd, NXLog, syslog-ng and OpenTelemetry Collector. These collect, normalize, filter, buffer and route telemetry; they are not themselves necessarily the place where an analyst hunts an incident.
Open a service to choose the right setup. A cloud-only SIEM shows a Connect area for its account/tenant and least-privilege API token, stored in the macOS Keychain, with no meaningless local Install button. A self-hosted or hybrid platform offers its vendor deployment path and a Remote Instance watch for the management console. Collectors with a real Homebrew formula can be installed and controlled locally; Linux/Windows agents and appliances link to their supported packages instead of pretending to be Mac services.
Sources & coverage links the layers rather than merging them. Use EDR Fleet for endpoint-console coverage, Security for host/network detections and intrusion prevention, and Logs for local troubleshooting. The SIEM destination owns full event retention, correlation, hunting and incident response. FrontierStack remains the health and control plane: it keeps credentials local, checks the pieces it can prove, alerts on lost reachability, and takes you to the correct console for the deep work.
10.9Read-only security audits
The fastest way to learn where a host actually stands is the AI's security_audit tool, which runs a comprehensive, entirely read-only sweep on This Mac or any linked server over SSH. It self-detects the OS and checks pending security updates, disk encryption (FileVault or LUKS), the firewall (Application Firewall + pf on macOS, ufw / iptables on Linux), SSH hardening, listening ports, UID-0 and privileged accounts, passwordless-sudo (NOPASSWD) entries, intrusion prevention and recent failed logins. It uses passwordless sudo only where it is available and degrades gracefully where it is not. Nothing changes; you get a prioritised list of findings and specific fixes, which you can then apply yourself or hand back to the AI behind the usual approval card. Set target to a server's name to audit it remotely; omit it for the local Mac.
10.10The Security Audit pane: an exploitable-only auditor in a sandbox
The read-only security_audit sweep above tells you how a host is configured. The Security Audit pane asks a harder question: what here can an attacker actually exploit? It turns a coding agent into an adversarial auditor that maps the target, hunts from many angles — injection, broken access control, authentication and authorization, business logic, cryptography, exposed secrets, SSRF, misconfiguration and chained attacks — then tries to disprove each of its own findings, so what survives is only the issues with a concrete attack path. Every finding carries a scenario and a fix; there is no theoretical noise.
It runs in two modes. Codebase points the agent at a repository or web-project folder and audits the source. Infrastructure audits your own estate from the signals FrontierStack already gathers — Cloudflare zones and their TLS/WAF settings, domain and certificate health, each pinned server's OS, exposed services, remote-access and MDM/Activation Lock/FileVault posture, and the local firewall — assembled into a redacted inventory the agent then attacks.
The whole run happens inside a Sandcastle Docker sandbox, so an adversarial agent pointed at untrusted code never touches your host directly. The app provisions the sandbox image and runner the first time you run an audit (it needs Docker or Podman running); after that, runs start immediately. Findings render with severity badges and can be saved to Obsidian or raised as Alerts for anything critical or high. As everywhere else, only a redacted prompt leaves your Mac — secrets are stripped first — and the sandboxed agent authenticates with your Claude subscription using a token from claude setup-token (or an Anthropic API key).
.env, private keys, service-account.json — is refused rather than mounted into the sandbox. Audit a clean checkout.10.11Strix: AI penetration testing
The audits so far are read-only: they inspect how a host is configured and where its code might be exploitable. Strix goes further — it runs an active penetration test. From the Strix AI Security Testing section of the Security pane you point it at a repository folder, a Git URL, a domain, a URL or an IP address (or pick one of your linked hosts), choose a depth of Quick, Standard or Deep, and it maps the attack surface, attempts real exploit paths, and writes a penetration-test report.
FrontierStack does this by driving the open-source Strix command-line agent locally on your Mac and reading the run artifacts it leaves on disk — the findings, the run metadata and the report — rather than scraping any hosted service. If the CLI is not installed the section says so and offers an Install Strix… link; Update Strix upgrades it through uv or pipx, never by piping a script into a shell. An AI provider key is optional; when you supply one it is stored in the macOS Keychain, handed only to the local Strix process, and never displayed or sent to any cloud model — the pane shows only whether a key is configured.
The tiles summarise the last run: Critical, High and Medium counts, duration, anything new in the last 24 hours, and any failed scans. A run in progress shows live phase text and a Stop button; when new critical or high findings appear you get a local notification unless Silence alerts is on. Open Findings and Export Report surface the detail, and Re-run Failed Scan and Restart Scan Engine recover from a bad run. Serious findings are treated as sensitive and are never sent to cloud AI. The AI Administrator can drive Strix as well, through strix_status, strix_scan and strix_control, all covered in Chapter 13.
10.12Certificate Sources and TLS
An expired certificate is a self-inflicted outage. The Certificate Sources dashboard gives you one row per issuance stack on the host — Let's Encrypt (via acme.sh), Certbot, Step CA, Traefik and Cloudflare SSL — with expiry read directly from the certificates themselves using openssl. Cloudflare uses the token and zone you configured for its analytics; sources that are not present on this Mac show dimmed. For Traefik you can point the dashboard at its acme.json; for Step CA, at its URL.
For issuing certificates, FrontierStack offers two paths. mkcert creates a locally-trusted certificate — ideal for development on .localhost or LAN names, where a public CA is irrelevant; the Certificates pane's Get action uses it when installed. For anything the public must reach, use Let's Encrypt: the AI's issue_certificate tool runs acme.sh or certbot on This Mac or a linked server, and for the DNS-Cloudflare method it reads a CF_TOKEN vault secret that is injected at run time, never sent to the model.
10.13Mail security
A mail server is two distinct risks: it can be spoofed (someone forges mail as your domain) and it can be abused (it relays mail for a stranger). FrontierStack addresses both, with tools that understand the old Apple Server case where Postfix sits underneath.
- Anti-spoofing DNS —
email_auth_dnsbuilds the SPF, DMARC and (optional) DKIM TXT records: SPF declares who may send for the domain, DMARC tells receivers how to treat failures, DKIM cryptographically signs outgoing mail. Withpublish=cloudflareit creates the records for you; otherwise it prints the exact records to paste into BIND, dnsmasq or your registrar. - DKIM keys —
generate_dkim_keyrunsopendkim-genkeyon the server for a domain and selector and returns the public key as the TXT record to publish; the private key stays on the server for the OpenDKIM milter. - Postfix hardening —
harden_mail_postfixapplies safe defaults over SSH withpostconf: require SMTP AUTH to relay (this closes an open relay), reject unknown and unlisted sender domains, optionally enforce sender/login matching. It reloads Postfix and prints the effective settings. - Open-relay test —
test_open_relayruns a safe SMTP conversation (EHLO / MAIL FROM / RCPT TO to an external domain, then QUIT without sending) and reports whether the external recipient was rejected (good) or accepted (an open relay — bad). - Delivery probe — from a server's Mail Server Policy section, send one tagged test message end-to-end through the relay and read the exact SMTP verdict: accepted & queued (with the queue id), deferred, rejected, or a TLS-certificate failure. This is what distinguishes “accepted then silently dropped” from real delivery — and on a relay addressed by its LAN IP, whose STARTTLS certificate can't verify, a Trust LAN relay option retries over an encrypted-but-unverified channel. On an Apple Server.app box FrontierStack also finds Postfix's real log even when the config leaves it to syslog/ASL, and reads the mail queue and the Server.app
/Library/Logs/Mail/files.
serveradmin, which can overwrite main.cf and silently undo a harden_mail_postfix change. Review the result afterwards and, if it reverts, re-apply the equivalent settings through Server.app.10.14Who may change things from outside
Everything above hardens the machines FrontierStack looks after. This section is about hardening FrontierStack itself — because an app holding SSH keys, database passwords and cloud tokens for a whole fleet is a more attractive target than any single server it manages.
FrontierStack can be driven from outside through several doors: the MCP server for AI clients, the inbound HTTP control server for webhooks and the mobile panel, App Intents for Shortcuts and Siri, and — when you enable them — agent integrations. Each already carries its own token. Above all of them sit two settings in Remote Control & Lock, and it is worth being clear about which question each one answers.
The App Lock answers what survives a lock. Set a password, lock the app, and the window is covered while every external surface is either blocked outright or held to read-only.
10.17.1Fleet: require a physical security key
A Fleet licence adds Physical security key immediately beside the password-lock settings. Choose Yubico YubiKey, Google Titan or FEITIAN ePass, then enrol the key through Apple's system security-key sheet. FrontierStack stores only the public credential; the private key never leaves the dongle.
Once enabled, FrontierStack starts locked and re-locks when it goes into the background. It does nothing — the window and every external control surface remain gated — until an enrolled key is connected or presented and you touch it. If you also configured an App Lock password, unlocking is two-step: the correct password and a physical-key touch are both required. A missing key never falls back to password-only access.
Register up to three keys and keep at least one backup somewhere separate. The supported families are YubiKey, Google Titan and FEITIAN FIDO2/ePass. On iPhone and iPad, use a compatible USB-C or Lightning key, or present an NFC-capable model when Apple's sheet asks. Removing the policy also requires a fresh touch from a currently enrolled key, so someone with an unlocked session cannot silently weaken it.
Paired devices and Script Secrets
With a key enrolled, Paired devices need the key too is on by default. Creating a pairing code, pairing KeyRotate and raising a paired device’s permissions — a higher level, the remote shell or AI changes — each take a touch on this Mac. Demoting or revoking a device never does. A phone’s secrets and shell requests are refused until a touch opens a device key session (15 minutes by default). When a phone asks without one, the key prompt appears on the Mac, at most once a minute. Locking FrontierStack closes the session, and Paired Devices shows whether it’s open.
The AI’s Script secrets can be sealed with the key too: Encrypt with Security Key… in AI Administrator stores the values in secrets.env.fsenc, encrypted with a key that only a touch of an enrolled security key can recover (FIDO2 PRF, macOS 26.4 or later). The names stay visible. The values need a touch after each launch or lock and relock after an hour; a script that uses one asks for the touch when it runs. Use Add Backup Key… for every backup key. Keys enrolled before this feature existed must be removed and enrolled again first, and FrontierStack won’t let you remove all keys while secrets are sealed to them.
SSH with a security key. In a linked server’s Edit Settings, Create Security-Key SSH Key… makes an ed25519-sk key on your security key, installs it on the server using the access you already have, and switches the server over only after a test session succeeds. You can optionally remove the old key from the server. Day to day, Open Key Session takes one touch, and monitoring, commands and terminals share that session until it has been idle for the timeout (60 minutes by default, set per server). While the session is closed, that server’s monitoring pauses rather than showing it as down, and nothing in the background ever waits for a touch. Apple’s built-in ssh can’t use FIDO keys, so this needs Homebrew’s OpenSSH — FrontierStack offers to install it. Stop Using Security Key… returns the server to its previous key.
External changes answers a different question: in an unlocked app, how much must an outside caller do before it can change anything? It applies to every external surface at once — the MCP server, the control panel, Shortcuts and the command line. Three levels. Full auto lets external tools act without asking — defensible only when you trust every connected client and the machine it runs on. Confirm each action, the default, puts an approval panel in front of every change, naming the caller. Password required demands your password before an external tool touches a server at all.
The confirm tier has a release valve that matters during an incident. Approving a change offers Allow for session, which grants five minutes — but only for that one caller and that one kind of action. Approving a service restart from an MCP client does not authorise a shell from that client, and does not authorise a restart requested through the mobile panel. The narrowness is the point: repeated prompting during an outage is exactly what drives people to switch to full auto permanently, and a grant that leaked sideways would be worse than the prompting it replaced.
Three properties hold at every level, and they are what make the setting trustworthy rather than merely configurable. Reading is never gated — a monitoring client keeps working whatever you choose, because a dashboard that goes dark during an incident is a liability. Credentials, shell access and FrontierStack’s own settings can never be changed from outside, at any level; those are refused rather than prompted, on the reasoning that a request arriving from a remote tool is simply the wrong origin for reading a password or running an arbitrary command. And session grants are never written to disk: quitting the app or locking it clears them, so a five-minute convenience cannot quietly become a standing permission you forgot you gave.
10.15Agent login with auth.md
Passwords are the worst credential to automate, so FrontierStack never asks you to paste a long-lived one for a third-party service. Instead it discovers auth.md — an open specification (originated by WorkOS) that a service can publish at https://<host>/auth.md to tell AI agents how to sign in on your behalf. A service's Connect ▸ Login Automation (auth.md) disclosure, and the AI's check_authmd tool, fetch that public file and summarise the advertised flows (agent-verified or user-claimed), scopes and OAuth endpoints — or report that none is published. The grant itself happens at the service and issues a short-lived, revocable, scoped token; FrontierStack stores no password. Cloudflare and Firecrawl publish an auth.md today, with more services appearing.
10.16The signed-request trust model (FS1)
FrontierStack's own control surfaces — the local control server, the MCP server, and the remote fsagent — are protected by a bearer token over TLS. A token alone, though, is a shared secret: replayable, and no proof of who is calling. The FS1 signed-request scheme adds a second factor on top. Every request is signed by an approved per-device Ed25519 key; the server keeps an allow-list of public keys and rejects anything signed by a key it has not explicitly approved. A leaked token then controls nothing on its own — this is the HTTP equivalent of the SSH keys your fleet already trusts.
Each request carries the device's key id, a timestamp, a random nonce and a signature over a canonical string. The server verifies the key is approved, the timestamp is within a 60-second window, the nonce is unseen (claimed only after the signature checks out, so a bad signature cannot burn nonces), and the signature is valid. The same scheme is implemented identically in the macOS app, the Go agent and the iOS client, pinned by a cross-language test.
You manage devices in the Paired Devices pane, in the Overview group of the sidebar (it used to live inside this Security pane). Each paired phone or tablet shows its label, key fingerprint, last-seen time, a scope picker and a Revoke button. Pairing is meant for one or two people with a couple of devices each — enrolment is capped at four — and each device carries a scope:
| Scope | Read status & logs | Restart services | Fleet ops | Tools / CLI / scripts |
|---|---|---|---|---|
readOnly | Yes | — | — | — |
restart | Yes | Yes | — | — |
operate | Yes | Yes | Yes | — |
full | Yes | Yes | Yes | Yes |
The same section holds the per-surface Require request signing switches for the control and MCP servers. Roll-out is deliberately gentle: the servers accept a token or a signature while signing is optional, with a bootstrap exception so you can enrol the first key with the token you already hold — turning on enforcement can never lock everyone out.
Two further per-device controls sit on each row. Allow AI Administrator (on by default, at any scope) governs whether that one phone may talk to the AI at all — you can let a trusted handset chat while blocking another, and the switch only ever restricts: even with it on, the AI still requires the app unlocked, a signed device, and a full-scope "Allow changes" for anything that mutates. Allow remote shell is offered only at full scope and is off by default; it is the explicit grant a phone needs to open a command-line shell and to install its own SSH key on your servers for direct access when this Mac is offline. If a handset is lost, Secure lost phone blocks the device and its older queued actions at once, closes its sessions, strips its direct-SSH keys from reachable servers and deactivates its push token; offline servers stay listed so you can finish the cleanup when they return.
Bluetooth pairing fallback. When a new phone cannot reach this Mac over Wi-Fi or Tailscale — a locked-down guest network, client isolation, a captive portal — enrolment can still complete over Bluetooth. Turn on Allow Bluetooth pairing (off by default) and the Mac advertises a short-lived GATT service only while the Pair dialog is open; the phone scans the same one-time QR code and runs the identical signed-enrolment handshake, just carried over BLE instead of HTTPS. Because the FS1 signature is transport-agnostic, the Bluetooth path inherits the same trust guarantees without a TLS channel.
restart, not full. Once every device is enrolled, turn on Require request signing for both servers (and require_sign on agents). After that a leaked or screenshotted token controls nothing, because the caller must also hold an approved private key. Revoke a device the moment a phone is lost or a person leaves.10.17Hardening the headless Mac
A display-less server has its own security trade-offs, and the Headless Setup tool (covered fully in Chapter 8 and Chapter 17) surfaces the one that matters most here: its System Status section warns when FileVault is on, because an encrypted Mac with no keyboard or screen cannot be unlocked at boot — it will sit at the FileVault prompt instead of coming back online. For a headless box you generally choose between full-disk encryption and unattended restart, and FrontierStack makes that choice explicit rather than letting you discover it after the next power cut. Enabling Screen Sharing or Remote Login on such a host is exactly the kind of exposure the Open Ports watch will then keep an eye on.
Chapter 11
Monitoring & Alerts
A continuous health sweep watches every service, device and subsystem you care about, and turns the first sign of trouble into a message on the app you already check.
A control panel that only lets you change things is half a tool. The other half is knowing when something has gone wrong — ideally before it becomes an outage. FrontierStack runs a continuous monitor sweep across everything you have told it to watch and turns the first sign of trouble into a message on whatever channel you choose. This chapter covers the Local Health board that summarises it all, the Alerts pane that raises and delivers warnings, the messaging gateways that carry them, and the specialised monitors for cloud services, project tools, power and storage.
11.1The Local Health board
Open Overview ▸ Local Health for the single screen that answers "is anything broken right now?" Every monitored service, device and subsystem appears as a row marked UP or DOWN, grouped by area — web and database services, the fleet, sites and certificates, disks, UPS and SNMP devices, connected cloud accounts. At the top sits a one-line summary in the form X up / Y down, so you can take in fleet-wide status in a glance without reading every row.
Groups are collapsible, but any group containing a failed item opens automatically. Select the history button on a row for its last 30 checks, measured response-time sparkline, exact rolling observed uptime over 24 hours, 7 days and 30 days, and recent transitions. Coverage sits beside each uptime value: app-off, paused and out-of-network time is unknown, never guessed as healthy. Fleet-wide Events retains at most 1,000 first observations, outages and recoveries for 31 days without storing endpoints, credentials or response bodies.
The board is the same data the AI Administrator reads through its get_server_health tool: ask it "what's down?" and it reports exactly what this screen shows, then offers to investigate before suggesting a fix (see Chapter 13). The sweep runs about every sixty seconds; each DOWN item is also attributed to the pane that owns it, which is why a red count capsule can appear on a sidebar row and on the Dock icon — you are told where the trouble is, not just that there is some.
11.2The Alerts pane: what is watched
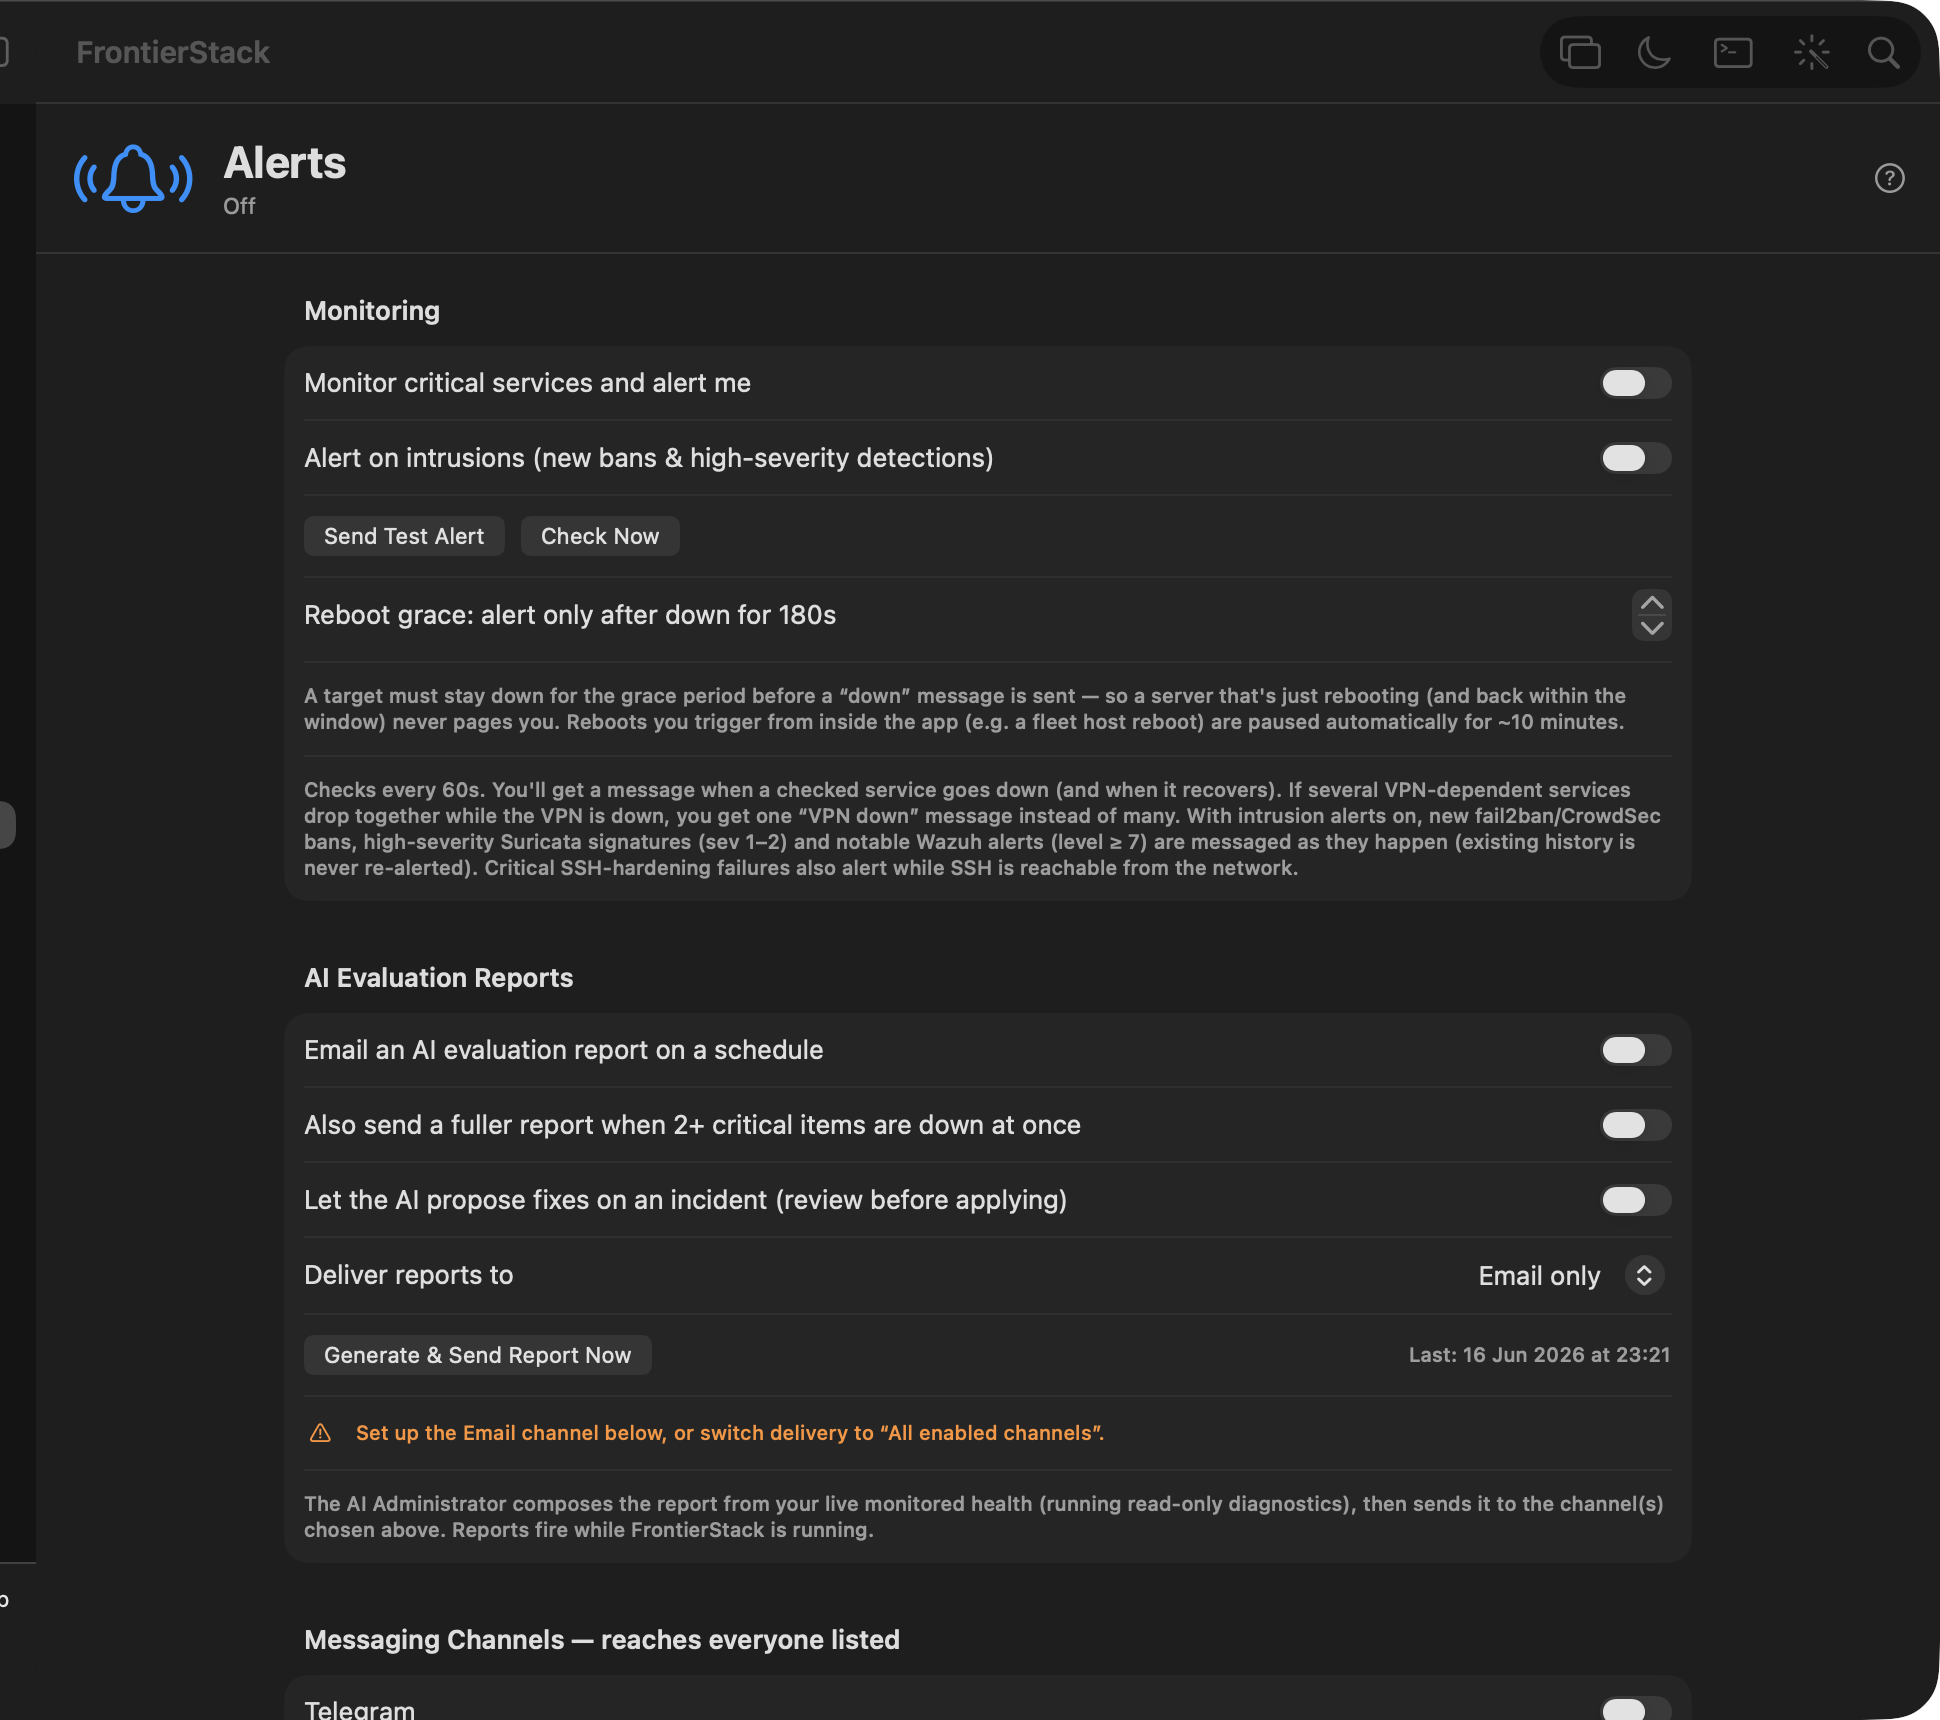
The Local Health board shows status; the Alerts pane (Overview ▸ Alerts) decides what is worth a message and sends it. Switch on "Monitor critical services and alert me" and the sweep starts raising alerts. What it watches:
- Site & service health — HTTP/loopback checks, TCP ports, and deeper protocol probes (an SMTP/IMAP login, a database
SELECT 1, an LDAP bind) so a service that is listening but actually broken still trips. The MySQL probe additionally reads the connection pool (current use vsmax_connectionsand the "too many connections" refusal counter): it alerts when the pool passes 90% or when clients were refused between sweeps, and every sweep is charted as Connection Health History in the Database Health pane — pool % over time with red lines marking refusal bursts and outages. - Linked servers — every fleet host's SSH endpoint is reachability-checked each sweep (a bare TCP connect, no login attempt), so a server that is completely off raises a plain "Server down" alert — and a "Server recovered" when it returns. This is separate from the SSH cool-down notice, which fires only when a host is up but rate-limiting connections.
- Certificates & domains — TLS expiry across the whole fleet, plus registrar / DNS / SSL checks that warn you days ahead rather than on the morning a domain lapses (Chapter 7).
- Disks filling up — a volume crossing its free-space threshold, surfaced from the Disk Health monitor below.
- Security exposure — a new open port or unexpected listener, a VPN tunnel drop, or a critical SSH-hardening failure while SSH is reachable from the network.
- Failed payments & billing — connected paid services (OpenAI, Anthropic, Cloudflare, Google Cloud) returning insufficient-quota, low-balance or auth errors — the symptom of a lapsed card.
- Connected cloud services — live monitors for Stripe, Shopify, Freshdesk, SendGrid and more, firing when a metric you chose crosses its threshold.
Most checks are threshold-based, so you decide what "trouble" means: alert when a certificate is within N days of expiry, when open tickets pass a number, when a disk crosses a percentage. Conservative thresholds turn a post-mortem into a heads-up. The pane also offers "Alert on intrusions" — new fail2ban/CrowdSec bans, high-severity Suricata signatures and notable Wazuh alerts (level ≥ 7) are messaged as they happen, and existing history is never re-alerted.
SwitchBot devices. Pinning a SwitchBot device watches it through the SwitchBot cloud. Plugs are read every 2 minutes and get the Wi-Fi-unstable warning; locks, sensors, curtains, Bots, lights, Hub 2/3 and other devices that report status are read every 10 minutes and alert when SwitchBot says the device, or the hub it connects through, is offline. Cameras and Hub Mini report no status and are never shown as offline. To stay inside SwitchBot's 10,000-calls-a-day quota the intervals lengthen automatically when many devices are pinned.
11.3Messaging gateways
An alert is only useful if it reaches you. The Alerts pane lets you enable several gateways at once and list multiple recipients per channel, so the right people are reached on the app they already have open. Paste a bot token or webhook URL, send a test, and you are live. The AI Administrator can enumerate the enabled gateways with get_messaging_channels and send through them with send_notification (Chapter 13).
| Gateway | Best for |
|---|---|
| Telegram | A bot token; multiple chats per gateway. Fast, free, reliable phone push. |
| LINE (Messaging API) | Reaching people who live in LINE, especially in Japan and Korea. |
| Slack / Discord | Incoming webhooks into a team channel; route ops alerts where the team already talks. |
| ntfy | Simple phone push via the public server or your own self-hosted ntfy. |
| Apprise | One extra hop that fans out to 80+ destinations (Pushover, Matrix, Gotify, Microsoft Teams, PagerDuty and many more). |
| Email (SMTP) | Anything that must land in an inbox; also carries the scheduled AI evaluation reports. |
| SMS / WhatsApp | Reaching a phone directly, via Twilio or the WhatsApp Business Cloud API. |
| Slack/Discord webhooks | Persistent team-visible history of every alert and recovery. |
| KakaoTalk | A "send it to me" alert for KakaoTalk users. |
| iMessage (Apple Messages) | A native "send it to me" alert straight from your Mac — no external service. |
| PagerDuty / Opsgenie (paging) | Real on-call paging with escalation — see below. |
11.16.1Paging the on-call (PagerDuty, Opsgenie, urgent ntfy)
The message gateways above are fire-and-forget text. The paging channels are different in kind: they are stateful. When a monitored item goes down, FrontierStack triggers an incident keyed to that item — PagerDuty (an Events API v2 routing key) or Opsgenie (a GenieKey) then runs your escalation policy, pushing, texting or phoning whoever is on call until someone acknowledges. When the item recovers, FrontierStack resolves the same incident automatically. Because the incident is keyed per item, a flapping service updates one incident rather than paging the rotation over and over, and nobody is woken for an outage that has already ended. Without an on-call service, the ntfy gateway's Page on down toggle sends "down" alerts at ntfy's maximum priority — a louder, repeating tone that overrides many phones' quiet settings — while recoveries and reports stay at normal priority. Each paging channel has a Send Test Page button that triggers a real incident and auto-resolves it about ten seconds later, proving the whole escalation path end to end.
11.16.2Telling someone else: contacts, presets and escalation
The channels above reach you. Many incidents also need someone else: a supervisor who wants an email, a second support person, or the technician who has to go to the site. Alerts ▸ Contacts & Escalation handles this in three parts.
| Part | What it is |
|---|---|
| Contacts | People other than you, each with a name, a role (Supervisor, On-site technician…) and the addresses you will use: email, mobile number (texts and phone calls), WhatsApp, Telegram chat ID, Messages handle, ntfy topic or LINE user ID. |
| Presets | Reusable recipes that say who gets told, by what method, and when. Each step names a contact, one or more methods, a delay, and whether it is urgent. A preset can also carry instructions added to every message, such as “Go to the server room, B1 rack 3”. |
| Rules | Which alerts use which preset: every alert, a category (Storage, Network & Routing…), a location, or one monitored item. Every matching rule applies, and anyone named by two rules is told once. |
For example, the preset Email the supervisor, page the on-site tech sends the supervisor an email and gives the technician a text and a phone call that reads the alert aloud. Tech now, supervisor if not fixed in 30 min is an escalation: the supervisor's step runs only if the item is still down 30 minutes later and nobody has pressed Acknowledge. Pending escalations are listed in the section and in the Alerts palette (Ack), and each one is cancelled automatically when the item recovers. People who were told something broke are told when it is fixed; nobody gets a phone call for good news, so an all-clear goes by text instead. Choose New Preset ▸ Start from a template to use a ready-made preset. It adds a blank contact for each role you don't have yet. Test sends every step at once, marked TEST, with delays ignored. On a pinned camera, router or other device, the offline-alert switch has a Who else gets this alert… button: it lists who besides you is told, and opens this section with a rule for that device already filled in, so you only pick the preset.
Contacts use the gateways you have already set up, with their own address in place of yours. Emailing a supervisor uses your SMTP account, and texts and calls use your Twilio number, which must be able to make voice calls. Those gateways can stay switched off for your own alerts. Each message states the contact's role, the location, and the preset's instructions, so the person understands why they received it. A missing address or an unconfigured gateway appears in Delivery Errors as, for example, SMS → Alex (On-site technician). A network failure is retried twice, two minutes apart, before it is reported.
IFTTT. Turn on IFTTT (Webhooks) in Messaging Channels to fire an IFTTT applet on every alert: value1 is the title, value2 the message and value3 is critical for a down alert or info otherwise. Give down alerts their own event name to trigger something louder, such as flashing lights, than a recovery does. A contact can also have their own Webhooks key, so a preset step fires an applet on their account. IFTTT's Webhooks service needs an IFTTT Pro plan.
Tokens and webhooks live in the macOS Keychain and never leave your Mac. You can also send a scheduled AI Evaluation Report: the AI Administrator composes a summary from your live monitored health (running read-only diagnostics) and emails it daily or weekly, or pushes it to all enabled channels — with an optional fuller report whenever two or more critical items are down at once.
11.4Delivery errors and how to fix them
A monitor is worthless if its alerts silently fail to send. FrontierStack verifies every send: when a gateway fails, it is recorded in the Delivery Errors section of the Alerts pane with plain-English fix-it guidance, the raw error underneath, and a Fix button that scrolls straight to the misconfigured channel's settings. A red badge appears on the sidebar's Alerts row and on the Dock icon so you actually notice, and it stays until you clear it. The AI Administrator reads the same list through get_alert_errors, so you can simply ask "why aren't my alerts arriving?"
The common causes are mundane and quick to fix:
| Symptom | Likely cause & fix |
|---|---|
| Email rejected at send | A blank SMTP From address, or a missing recipient — fill both in the Email channel. |
| Email connection refused / times out | Wrong port or transport; match your provider (587 STARTTLS or 465 SSL) and host. |
| Telegram / Slack / Discord 401 or 404 | A bad or revoked token / webhook URL — paste a fresh one and send a test. |
| Reports never arrive | Report delivery is set to "Email only" but no Email channel is configured — switch to "All enabled channels" or set up Email. |
11.5The on-host Service Watchdog & database health
The monitors above run on your Mac. For a critical server you also want a watchdog that lives on the box itself, so it keeps working when your Mac is asleep, offline, or simply not the machine that failed. FrontierStack's Service Watchdog is deployed with the host monitor (Chapter 8): it health-checks a service on a short interval, restarts it when it fails, and — as a last resort, and only when you have allowed it — reboots the machine, with a minimum-interval guard so a still-broken service can't cause a boot loop. Each watch has a check type: a process check, an HTTP or TCP probe, or a purpose-built MySQL or PostgreSQL check.
11.16.3A recovery ladder for pinned servers
The pinned server's Service Watchdog panel can add two opt-in steps after ordinary on-host service recovery. Reboot from FrontierStack lets the Mac issue one verified reboot after a new Recovery exhausted event. You choose the delay. If a controllable outlet is linked in Power Control, the next step can power-cycle the server after it remains completely unresponsive for the chosen period. FrontierStack waits 90 seconds after the reboot attempt before judging the host, and the power timer has a five-minute minimum.
The hard-power test is deliberately stricter than a failed SSH login. The Mac must have a healthy network path, and the server must have no SSH response, no healthy monitor report, no ping or ARP evidence, and no response on the common service ports. Any sign of life cancels that incident. A power cycle runs once, then the ladder stops. Old watchdog events are marked handled when you enable the policy, and watchdog_reboot_suppressed remains final, so the app cannot defeat the helper's boot-loop protection.
11.16.4Keep watching while the Mac is closed
A wedged server cannot reliably operate its own smart plug. Choose a different enrolled server under Recovery observer to put the last step on that machine's helper. The observer keeps probing the target by private IP, ping, and several TCP ports even when FrontierStack is closed. It first confirms that the private power controller answers its status request, persists an anti-loop receipt, cuts power for the configured dwell, restores power, and performs no second cycle until it has seen the target alive again. A persisted 30-minute cooldown also survives an observer restart.
fsck, xfs_repair, chkdsk and similar filesystem tools can temporarily stall every service on the system disk. Both the local Service Guardian and the on-host Service Watchdog recognise those repair processes and pause automatic recovery — including service restarts and remote reboot escalation — without changing your saved policy. Failure counters are cleared, and recovery waits another 60 seconds after repair ends before starting fresh. The desktop and phone show the hold. A manually confirmed service control remains available if you deliberately need it.The database Heartbeats catch failures a process/port check misses. A MySQL Heartbeat asks for SELECT 1 without a password. Success or “access denied” proves that MySQL answered; a refused, timed-out or saturated connection is unhealthy. No MySQL password is stored and no tables are read. A blank probe name becomes the non-root fs_watchdog, which need not be a real account. A PostgreSQL Heartbeat uses pg_isready without a database username or password. With error-log early-warning switched on, the watchdog also tails the database's own error log and raises a critical event the first time it sees a corruption signature. Because all of this runs on the server, it can alert you autonomously over ntfy or a webhook even while your Mac is off; turn that on with Alert me directly from this server in the host's Service Watchdog panel.
Aborted_connects — about two a minute, several thousand a day. Nothing is wrong: the server is healthy and the check is doing its job. But the counter fills with the Heartbeat's own traffic, which can hide a real signal such as a brute-force attempt or a misconfigured app. The MySQL Heartbeat panel offers an optional fix: create fs_watchdog@localhost and [email protected] with an empty password and no privileges at all (USAGE only — the account can read nothing and cannot connect from off the server), so the probe logs in cleanly and is counted as an ordinary connection. FrontierStack creates it only when you ask, using the MySQL administrator password you saved in Database Health, and shows the exact CREATE USER statements before running them; you can copy the SQL and run it yourself, or remove the account later from the same panel. Leaving it alone is a fine choice — the count is cosmetic.mysqlcheck integrity scans, verified backups and optional auto-repair, choose Open table checks & auto-repair in the watch or open Database Health, then expand the database's Scan & repair settings. Use a dedicated account such as frontierstack_health@localhost, never root. Grant USAGE for login and SELECT 1; add PROCESS only for fleet-wide connection visibility and SELECT only on schemas you explicitly inspect. Restrict the account to localhost or the monitor's exact private address. FrontierStack runs the client on the server, so there is no reason to expose MySQL to the wider network.To create a check-only account, replace your_database and the example password:
CREATE USER 'frontierstack_health'@'localhost' IDENTIFIED BY 'use-a-unique-random-password';
GRANT SELECT ON `your_database`.* TO 'frontierstack_health'@'localhost';
Save that login in Database Health. Leave auto-repair off until both a manual check and verified backup succeed. If a complete backup or repair needs another privilege, add only the schema-scoped privilege MySQL names; never use *.*. For a monitor connecting from another machine, replace localhost with that one exact private address.
The pinned server's Services row shows a green DB checker: On dot while scheduled table scans or server self-heal are active, Paused when a target exists but neither is running, and an orange Needs login instead of green when a selected MySQL scan has no database password. Database Health and the Heartbeat are complementary: the former checks tables on a slower schedule, while the latter detects outages quickly and can restart MySQL on the server.
When a database isn't down but is slow or stuck, the Why slow/stuck? button on each target in the Database Health pane answers it on demand: it reads the server's live activity (SHOW FULL PROCESSLIST on MySQL, pg_stat_activity on PostgreSQL), groups the running queries by shape so a burst of the same query collapses to one line with a count, and states the verdict — a single query hammered in a burst, a long-runner blocking others, connections waiting on a lock, oversized result sets streaming to clients (the bandwidth cost), or connections near the ceiling. A useful subtlety: if the load is bursty it may read idle between spikes, and the tool says so and tells you to re-run during one, rather than falsely reporting all-clear. Remote targets are probed over SSH, so no database port need be exposed.
11.16.5Pausing checks for maintenance
A watchdog that restarts things is exactly what you don't want while you are deliberately taking a service down. Rather than switching protection off — and relying on yourself to remember to switch it back on — use Pause Checks… in the Guardian's header, or the pause button on an individual service row. Choose a window from 15 minutes to a day.
While paused, the Guardian stops health-checking and stops restarting whatever you paused, so your work doesn't fight it. Nothing is disabled and no setting is lost. Keep Alive, Auto Recover, thresholds and intervals are all left exactly as they are, and checking resumes on its own when the window ends — or immediately, if you press Resume Now. A pause never survives its own window, even if you quit and reopen the app.
11.6Case study: the High Sierra Server.app serviceproxy wedge
Old Macs still running macOS Server (Server.app) on High Sierra have a well-known failure: the web front proxy — the launchd job com.apple.serviceproxy, which binds ports 80/443 in front of the real backend — occasionally wedges. It keeps accepting TCP connections but never answers them, so every website behind it goes dark while every process check still looks healthy. There is no fix from Apple; the stack is end-of-life. The Service Watchdog was built with exactly this case in mind.
How to set the watch up. On the server's pane, add a watchdog entry for the service name serviceproxy and — this is the important part — give it an HTTP check with the target http://127.0.0.1/, not a process check. The HTTP probe is the only check that sees the real failure (connections accepted, no answer); on failure the watchdog heals it with launchctl kickstart, which is precisely the manual fix an admin would type. Any HTTP status below 500 counts as alive (a 403/404 from the proxy still proves it is answering); each probe times out after 6 seconds, so a wedged proxy fails the check by timing out. The backend behind the proxy can be watched the same way as server-httpd.
Timings that work well. Check every 30 seconds; restart after 3 consecutive failed checks; try up to 3 restarts; leave the post-restart grace at its default (~20 s, generous enough for Apache on old hardware). That confirms a wedge for ~90 seconds before acting — long enough that one slow response or a momentary load spike never triggers a kickstart, short enough that sites are back about two minutes after a real wedge, hands-off. If the sites are critical, tighten to a 15–20 s interval with 2 failures (≈40 s to confirm) — going tighter than that mostly buys false restarts, because a genuinely slow old box can take a few seconds to answer under load. Leave “Reboot the server if recovery still fails” off unless the machine is truly unattended: a kickstart resolves the wedge in practice, and reboot-as-last-resort on a box like this mostly adds downtime (the anti-boot-loop guard enforces at least 30 minutes between watchdog reboots regardless).
Why not a process check? There is no process named serviceproxy — the job runs as httpd with a special config — and monitors older than v1.6.1 read a healthy proxy as permanently “down” because of that, restarting it over and over and, if reboot escalation was allowed, rebooting a healthy machine on a schedule. From v1.6.1 the monitor asks launchd for the job's real state instead, so a process check now tells the truth; the HTTP check remains the one that catches the actual wedge. If an older server of yours has been rebooting with no visible cause, check its monitor version first — and note that “Why did it reboot?” attributes watchdog-initiated reboots explicitly (with the reason, on v1.6+ monitors; older monitors leave a stamp that is still reported).
serviceproxy altogether: the Apple Server Migration wizard (Chapter 8) inventories a Server.app machine and moves its websites to a plain Apache on a supported system, taking the wedge-prone proxy out of the serving path. Until then, the HTTP watch keeps the old box honest.One guarantee closes the loop on delivery: an alert is never silent. On top of the messaging gateways, every state-change alert also raises a native macOS notification and push, independent of the gateways — so even with email off and every channel disabled, a service going down still reaches you on the Mac. Database recovery — running mysqlcheck/pg_amcheck and the AI-guided rebuild — is covered in Chapter 5.
11.7Incidents, on-call and status pages
For teams that already run formal incident response, FrontierStack connects to the tools you use rather than replacing them. Each has a live pane reached from its catalog entry: paste a read-only API key and it shows current state.
- Incident management & on-call — PagerDuty (open and high-urgency incidents, who is on-call, services), Opsgenie (open/unacknowledged alerts, with a US/EU region toggle), incident.io and Rootly (active incidents).
- Status pages — Statuspage (unresolved incidents and components that are down) and Better Stack (monitors up / down / paused).
Set up the key in each pane (for example PagerDuty ▸ Integrations ▸ API Access Keys) and the pane confirms the connection. These feed the same monitoring picture, so an open PagerDuty incident or a down status-page component shows alongside your own health.
11.8SaaS live monitors & project-management panes
FrontierStack does not stop at infrastructure. A config-driven SaaS live monitor watches connected cloud accounts and refreshes every few minutes. Each service has a credentials form, live metric tiles, an "Alert me" toggle and a threshold; alarmable services raise a DOWN alert when the metric crosses the line, and the rest are watched for reachability. Live monitors include Stripe (disputes needing response, balance), Shopify and WooCommerce (open orders), Freshdesk and Zammad (open/pending/overdue tickets), SendGrid, Mailgun and Postmark (bounces and blocks), GitHub Copilot (inactive seats), and identity providers Okta and Microsoft Entra ID. Pin a service to make it always-on-Local-Health regardless of its alert setting.
The dedicated GitHub pane adds account and repository totals, Actions-related work, PRs, requested reviews, assigned issues, unread notifications, API requests remaining and release-asset download counts from the five most recently updated repositories. Anthropic account/model monitoring and GitHub Copilot seat usage need only their API credentials; no host or port is invented for a cloud-only service.
AppSignal has a dedicated read-only live connection. Enter the application ID and a personal API token; the token is stored in Keychain and FrontierStack uses AppSignal’s GraphQL API to show open error incidents, active uptime alerts, the latest deploy and available last-hour error/latency metrics. The alert threshold combines open incidents and uptime alerts. AppSignal requires its API token in the GraphQL URL, so FrontierStack constructs the URL privately and never writes the authenticated URL to logs. For deeper investigation, add the AppSignal preset in MCP Servers: it opens AppSignal’s hosted MCP through a version-pinned OAuth bridge, without copying the monitoring token into an AI client. Keep AppSignal access read-only until you have reviewed any write-capable tool.
Paessler PRTG has a dedicated live connection for both a self-hosted PRTG core and PRTG Hosted Monitor. Open the PRTG service, enter its HTTPS base URL, and create a Read access scripting key under Setup ▸ Account Settings ▸ API Keys. FrontierStack stores the key in Keychain, reads a bounded sensor-status table, and shows Up, Down, Warning, Paused and other sensor totals. Turn on Alert me when this needs attention to feed Down sensors and sensors without a connected probe into Alerts. The integration never acknowledges alarms or changes devices, sensors or probes. PRTG Network Monitor and Enterprise Monitor run their core service on Windows; use the linked Windows server and vendor installer, or use Hosted Monitor. Remote Windows probes and multi-platform probes extend collection into the rest of the fleet.
NinjaOne, Atera and Site24x7 also have dedicated read-only live connections. NinjaOne uses a Client Credentials application with Monitoring scope to summarise devices, offline endpoints, active alerts and running jobs. Atera uses a targeted API key limited to Agents and Alerts. Site24x7 exchanges a read-scope Zoho refresh token in the account's regional data centre and reads current monitor states. Their secrets remain in Keychain, responses are size-bounded, and none of these connections patches endpoints, runs jobs, closes alerts, starts maintenance or changes vendor configuration.
The same pattern gives project-management tools live token-login panes: Jira (open / unassigned / blocked / in-sprint counts), Linear, monday.com, OpenProject, Plane and Taiga. These are dashboards rather than alert sources, but they put your team's workload in the same window as the servers that run it. Email delivery has its own unified Email Delivery pane that combines transactional-provider metrics with SPF/DKIM/DMARC checks (Chapter 7).
11.9Queue Operations
Queue Operations is a read-only dashboard for RabbitMQ, Kafka, NATS/JetStream, Redpanda, AWS SQS, Azure Service Bus, Google Pub/Sub, Celery/Flower, Redis Streams, Apache Pulsar and Apache RocketMQ. Add one monitor for each broker, namespace or cloud account. FrontierStack shows queue or consumer-group names, ready and in-flight counts, consumer counts, lag, dead-letter counts and oldest-message age when the provider exposes them. It never reads or stores message bodies.
Client and administration ports are kept separate. For example, RabbitMQ clients use AMQP on 5672 while its management API normally uses 15672; NATS clients use 4222 while monitoring normally uses 8222; Pulsar clients use 6650 while its HTTP admin API uses 8080. Keep monitoring endpoints private. Use TLS and a monitoring-only account whenever the dashboard is not reached through the on-host FrontierStack monitor.
For a linked server, select its installed monitor and FrontierStack asks the credential-free helper for bounded summaries over the signed connection. Cloud providers use their normal local CLI profiles or a scoped credential saved in Keychain. Critical thresholds join the Alerts sweep, the same sanitised summaries are available in the iPhone/iPad app, and the AI Administrator can answer queue-health questions through the read-only get_server_health tool. The dashboard has no purge, delete, publish, acknowledge or replay action.
11.10UPS monitoring and SNMP devices
Open Power Control and use its UPS section for battery-backup monitoring. FrontierStack reads USB UPS devices directly from macOS power sources, queries NUT with upsc, and queries APC devices through apcupsd with apcaccess. These paths cover APC, Eaton, CyberPower and Vertiv, including Liebert models, as well as other devices supported by macOS or NUT. NUT can also expose serial and network UPS devices.
NUT is free, open-source software and requires no subscription. Status reads need no API key, so the NUT service pane intentionally has no API-credential or Plan & Cost card. A dedicated NUT command login is only needed when you opt into reviewed UPS controls; paid support or hosted dashboards are separate products.
The same pane supports switchable Raritan / Legrand Xerus PDUs. Add the private HTTPS address, the number printed on the outlet, and a dedicated account limited to outlet control; its password stays in Keychain. FrontierStack reads the exact outlet state and genuine active-power sensor when present, supports On and Off, and uses Xerus's atomic cyclePowerState method for Cycle. It refuses public addresses, embedded credentials, redirects and arbitrary JSON-RPC methods. Off and Cycle show a fresh destructive-action confirmation, and the AI Harness receives the same confirmation gate.
Each row shows the readings supplied by that model: charge, estimated battery runtime, load, real power in watts, input and output voltage, battery voltage, frequency and temperature. A watt value reported by the UPS is shown directly. If the device reports rated real power and load percentage but not current watts, FrontierStack shows a value marked estimated. It does not treat volt-amperes as watts.
Turn on Alerts, then set the charge, runtime and load thresholds. Utility-power loss, low runtime, low charge, high load, a battery-service warning, forced shutdown and communication loss are tracked separately. This means a falling-runtime alert can arrive after the first on-battery alert instead of being hidden by the existing outage. A disconnected unit remains visible as Comms lost. Pin a UPS to keep its overall health in Local Health and on the Places map. The NUT and apcupsd install buttons add those optional tools when needed.
Battery shutdown rules can now carry out the whole orderly sequence: wait until the UPS has been on battery for a chosen time or falls below a charge threshold, stop named managed services and VM services in order, verify each stop, and shut down the protected host last. A failed verification halts the ladder with the host still running; returning utility power cancels the unfinished stages. If PowerChute Network Shutdown should be running on the host, FrontierStack can detect common service names or accept a manual declaration, alert separately when it disappears, and either stop or continue the configured fallback.
A scan waits for NUT and apcupsd to answer. While it is running, Stop abandons the wait, keeps readings already found and pauses automatic refresh until you press Refresh.
A server or ordinary pinned device has two separate setup dialogs in its Power section. Add power control… is for the switchable path: a SwitchBot Plug, a configured Home Assistant, Shelly, Tasmota, private HTTP, Raritan PDU or Anker SOLIX outlet, a command-based PDU, or a power-capable Remote KVM. The dialog also links directly to the SwitchBot, Home Assistant, Anker SOLIX and TP-Link Kasa/Tapo provider panes; providers configured natively in Power Control open there. Add backup power… is for a pinned monitored UPS, Mini DC UPS, or Unmanaged / dumb UPS. Treat a PDU as a controller: assign every physical outlet its printed number in Power Control, then select that named, numbered outlet for the server or device. A pinned PDU is also offered for command-based control, whose exact outlet number and commands are entered directly in the server's Power section. SwitchBot remotes and sensors are excluded. A protected device may have both a smart plug and a dumb UPS. A device marked as a Smart Plug is itself a power controller, so its pane omits the entire Power section rather than offering another controller. A linked monitored UPS contributes real battery, runtime and warning status. Unmanaged choices take maker and model notes and remain inventory-only, so FrontierStack and the AI Harness expose no invented readings or controls. TREEDIX is available for its 5 V Raspberry Pi UPS controller as a Mini DC UPS.
Outlet reachability. In Power Control, edit an outlet and turn on Alert when this outlet is unreachable. FrontierStack checks the outlet every 2 minutes with a read-only probe and alerts after 2 missed checks in a row. It does this only while this Mac is on the same physical network, identified by the router's hardware address, where the outlet last answered. A laptop away from home, or on a network that reuses the same addresses, is never told its plugs are dead. For plugs this Mac can't reach, use the Shelly Cloud pane (IoT). Paste the authorization cloud key and server address from the Shelly app, add each device ID, and turn on the bell for offline alerts. When a Shelly is watched both ways, the local check wins while you are on its network.
11.16.6Link a device to a numbered PDU outlet
- In Power Control, add one outlet record for each physical PDU socket you want to use. Give it a useful name and enter the number printed beside that socket; for example, Rack server · Outlet 4.
- Open the pinned server or device, expand Power, and choose Add power control…. Configured outlets appear by name and physical number. Select the exact outlet feeding that device.
- If no configured outlet is available, choose Add a smart plug or PDU in Power Control…. FrontierStack opens the setup pane so you can supply the controller's private IP address or URL and add its outlets; it does not create an empty PDU link.
- If a PDU with an address is already pinned but has no native FrontierStack outlet integration, select it under Command-based PDU / powerboard. Enter that device's outlet number plus the reviewed On and Off commands in the server's Power section. The commands are configured there, not in the selection menu.
- Choose Add backup power… separately for a UPS. A pinned UPS appears there because it describes the device's backup supply; it is not the switchable PDU outlet.
Do not link the server to the PDU as a whole when individual outlets can be identified. FrontierStack includes the outlet number in the row label and in destructive-action confirmations, so the operator can verify the physical socket before an Off or Cycle action.
11.11Remote KVM platforms and power
The Remote KVM pane records multiple PiKVM, JetKVM, TinyPilot, NanoKVM, Raritan Dominion, ATEN, Vertiv Avocent, Lantronix Spider/SpiderDuo, Adder, GL.iNet, AWERAY and generic KVM-over-IP appliances. Each record keeps its exact model or firmware, can be pinned, and opens its private browser console; AWERAY records launch the selected companion app.
Power control is exposed only when a reviewed path is configured. PiKVM uses its documented local ATX API and checks that ATX is enabled, idle and in the expected current state before sending a hard action. JetKVM uses the shared MQTT connection with one exact base topic: it reads the retained ATX state before a short or long press, while its DC extension uses explicit ON and OFF messages; commands use QoS 1 and are never retained. TinyPilot and NanoKVM power hardware, and the enterprise vendors' PDU integrations, differ by model and firmware, so those records remain console/inventory-only unless an explicit private endpoint is supplied. A Raritan PDU associated with a Dominion target should use the reviewed Xerus entry in Power Control. KVM Off and Cycle require fresh confirmation in both the pane and AI Harness.
11.12Home Assistant entity monitors (Beta)
If Home Assistant already runs your building, FrontierStack can watch what it sees. Open the Home Assistant service pane, enter its URL and a long-lived access token, and the Entity Monitors section appears. Press Load Entities from HA, pick an entity, and give it a rule: numeric (is above / is below) for a temperature, humidity or power reading, or text (equals / is not) for a binary sensor's on/off, wet/dry or home/not_home state. Each watch becomes an ordinary Alert, checked on the usual sweep.
This is the right home for the sensors that can never be pinned as devices. A Zigbee leak sensor under the server-room floor, a Z-Wave door contact on the rack, a Bluetooth thermometer — none of them has an IP address, so none can be pinged. Home Assistant already speaks their protocols, so their readings arrive through it. Home Assistant 2026.9's shared Modbus bus access extends the same idea to solar inverters, PDUs and energy meters: HA polls the bus and FrontierStack reads the named values, rather than the two products fighting over one serial connection.
Two deliberate behaviours. An entity reporting unavailable or unknown raises its alert instead of being skipped — a leak sensor that has gone quiet is exactly the one you need to hear about. And the monitor is read-only by construction: it never calls Home Assistant's service API, so it can read your building but cannot switch a light, unlock a door or open a valve. Switching stays in Power Control, where every action is explicit and confirmed.
Unavailable devices. Rather than watching entities one by one, turn on Alert when any device becomes unavailable. Once a minute FrontierStack reads every entity in the domains you choose and alerts on any that Home Assistant marks unavailable. An entity that is merely unknown (no value yet) doesn't count, and nothing is reported offline while Home Assistant itself is unreachable. Alert after (default 10 minutes) keeps short blips and HA restarts quiet. If many entities fail together (more than 30% or more than 50), you get one alert, "Home Assistant: N devices unavailable", instead of dozens, because the cause is usually the same: HA restarting, a Zigbee/Z-Wave bridge down, or the network. Use Exclude (or the button on each row) for retired devices you haven't deleted from HA.
The same connection powers Import from Home Assistant in Device Discovery: the network devices HA tracks, listed with the names you gave them there, pinned in one click — individually or all at once. Imported devices behave exactly like scan results, with health checks, Places and licence limits applying as normal, and anything already pinned filtered out. Both features are marked Beta while Home Assistant 2026.9's device-registry API settles; importing full registry detail (areas, models) waits for that.
For anything else that speaks SNMP — managed switches, printers, network UPSes, NAS units — the SNMP / OIDs section of a device's detail pane queries it directly. Choose legacy SNMPv2c or SNMPv3; the recommended v3 profile uses SHA authentication with AES privacy. Passphrases remain in Keychain and are passed to net-snmp through an owner-only temporary configuration file, never command arguments. Pick a built-in template (System, Host Resources, Interfaces, Printer RFC 3805, UPS RFC 1628, Synology, QNAP, APC PowerNet) and press Query for a label-and-value readout, or fetch a single custom OID by hand. You can also watch an OID: set a comparison and threshold and FrontierStack polls it and raises an alert when the condition is met.
11.13Zigbee and Z-Wave devices
Offline alerts. On the Zigbee pane, click the bell on a device (or Alert on All) to be alerted when it drops off the mesh. With Zigbee2MQTT this needs availability turned on in Zigbee2MQTT's settings. Without it the pane shows an orange note, because FrontierStack can't tell a quiet device from a dead one, and it never guesses. deCONZ reports reachability for lights. Watched devices are checked every minute, even with the pane closed.
The Zigbee pane also watches Z-Wave nodes driven by Z-Wave JS UI. In Z-Wave JS UI, enable the MQTT gateway (Settings ▸ MQTT) on the same broker Zigbee2MQTT uses and keep Retain on. Then turn on Z-Wave JS UI via MQTT in the pane's Z-Wave section and enter the same prefix (default zwave). Each node shows as alive, awake, asleep or dead; ring its bell to be alerted when it goes dead. A sleeping battery node is normal and counts as up. If the gateway is offline, has not reported, or the last read is more than five minutes old, every node shows as unknown and no alert fires — FrontierStack never reports an unknown state as offline.
The same SNMP profile is used by Device Discovery, Network Path and PoE monitoring. PoE writes use SNMPv3 when the configured user has write permission; SNMPv2c keeps its separate per-switch write community. The AI Harness can inspect the non-secret profile, read numeric OIDs from pinned devices and list PoE state. Its write tool has no arbitrary OID operation: it is limited to reviewed PoE on/off/cycle actions, needs changes enabled and pauses for a fresh visible manual confirmation.
11.14Music Assistant
Music Assistant is the Home Assistant team's music server: streaming services and local files in one library, played on AirPlay, Google Cast, Sonos, Squeezebox, Snapcast and DLNA speakers. When it fails, nothing crashes — a streaming login expires, an upgrade breaks a speaker integration, a speaker drops off the network — and nobody notices until the music doesn't start. Open the Music Assistant service pane (Home Automation), enter the server URL (usually port 8095) and a long-lived access token from Music Assistant ▸ Settings ▸ Profile.
On every Alerts sweep the monitor checks three things: that the server answers and accepts the token; that no music or player provider has failed to load or needs signing in again; and that the speakers you switched to Alert when offline are still available. Speakers are opt-in because phones and laptops come and go all day. The monitor only sends list commands, so it can never start playback, change volume or edit settings.
Service Scan and Discover Services recognise a Music Assistant server on port 8095 from its /info response and show its version, rather than guessing from the port alone.
11.15Disk, RAID and SMART health
Drives fail with warning if you are listening for it. The Disk Health pane (a built-in monitoring tool) combines several layers. Volume space and Time Machine status are always shown. With smartmontools installed (a one-click Install button), each physical drive is enriched with deep SMART attributes — health, temperature, power-on hours, reallocated and pending sectors, and predicted-failure flags — visible per drive with a Check button and a Details sheet for the raw report. A drive trips an alert on a SMART failure or on concerning attributes (reallocated/pending sectors or a predict-fail), not only on outright death.
Software AppleRAID sets (mirror, stripe, concat) appear in their own section with level, status and per-member state; an alert fires when a set is degraded or a member drops offline. Under Alerts & Thresholds, switch on disk alerts and they route to your channels exactly like every other monitor.
Taken together, these monitors give you one board to glance at, one pane to tune, and one set of channels to reach you on — and an AI Administrator (Chapter 13) that reads the same health and sends the same notifications on your behalf. The host monitors that feed fleet-wide CPU, memory and GPU metrics into this picture are covered in Chapter 8.
11.16The Server Activity window
When you want to watch every box at once rather than configure one, open Monitors ▸ Server Activity Window (⇧⌘A, or the gauge button in the toolbar). It is a separate window holding only your pinned servers and the pinned devices that can report live state — routers and firewalls, UPS units, PoE switches, mining rigs, KVM consoles and smart plugs — and none of the rest of the app. Each tile shows the metrics you asked for with a sparkline and a status dot, and turns orange or red when something needs attention.
Layouts decide what is on the board: the built-ins are All Servers, Macs, a compact Cluster grid sorted by CPU, Mining Rigs & GPUs, Network & Power and Everything. Customise a copy or make your own — kinds of target, a server filter, individual members, the metrics and their order, tile size, grouping, sort and the sampling interval. Readings come from the FrontierStack monitor where one is installed and otherwise from one SSH round-trip; sampling runs only while the window is open.
| Tab | What you can do |
|---|---|
| Overview | KPIs, usage charts (live, or 24 h / 7 d from the monitor), network and temperature charts, system facts, top processes, posture chips. |
| Processes | Sort, search, kill or force-kill. |
| Services | systemd / launchd / OpenRC: start, stop, restart, enable, disable. |
| Docker | Containers with live CPU, memory, network and block I/O; logs; start, stop, restart, remove; images; Create Container… and Install Stack…. |
| Apple Containers | Apple's container CLI on a Mac host: what is running, start and stop, logs. Hidden on Linux and Windows hosts, where the CLI does not exist. |
| Kubernetes | Read-only cluster health where the host has kubectl: nodes and pods with a dot each, and the context they came from. |
| Files | Browse, edit text files, drag-and-drop upload, download files or folders, new folder, delete. |
| Ports · Logs · Terminal | Listening ports and connections; the log viewer; an in-window terminal with several sessions. |
| Users · Packages · Cron · Firewall | The same remote-management tools as the server pane. On a Mac the Packages tab is named Homebrew, since that is what a Mac actually uses. |
| Power | Reboot (or reboot via the monitor when SSH is wedged), plug / PDU / KVM power, PDU commands, linked UPS, Wake-on-LAN. |
The window is meant to be driven from the keyboard. Arrow keys move the selection through the board or the list, with up and down stepping a whole row of tiles; ⌘↑ and ⌘↓ jump to the first or last target; ⇧⌘0 returns to the board; and esc steps back out — detail, then board, then closing the window. ⌘1 to ⌘9 switch straight to a layout, ⌥⌘← and ⌥⌘→ cycle through them, ⌘E edits the current one and ⌘⌫ hides the selected target from it. ⌘F focuses the filter, ⌘R samples now, ⌥⇥ moves between a server’s tabs, ⌘T opens a terminal window, ⇧⌘O opens the selection in the main window, ⇧⌘K runs one command on every server, and ⌃⌘S shows or hides the list. Press ⌘/ for the full map at any time.
Run on All… runs one command across every server in the layout. Devices have their own detail: gateways and IDS alerts for a router, battery and voltages for a UPS, per-port control for a PoE switch, hashrate and shares for a rig, console and power for a KVM, state and watts for a plug.
A connected Proxmox VE cluster adds one tile per node to the All Servers, Cluster and Everything layouts, with CPU, memory, disk and uptime sparklines and a count of running VMs and containers. Its detail lists every guest with start, shut-down, reboot, stop and reset controls, the node's storage and the cluster's quorum, and offers Boot an ISO… into the Boot Media pane. Connecting a cluster is covered in Chapter 8.
Three controls sit in the window's own titlebar. Appearance makes this window alone dark or light — useful for a monitoring board you want dark while the rest of the app stays light — cycling follow-the-app, dark, light. Tab layout moves a selected server's tabs between a strip above the content and a vertical list beside it, which suits a tall window and shows every tab at once. Keyboard opens the shortcut list. Both toggles are also in the layout editor, and on ⇧⌘D and ⇧⌘L.
Part IV
Scripts and schedules, the AI Administrator, MCP, and the AI stack — the four chapters that turn FrontierStack from a control panel into something that works on its own.
Chapter 12
Scripts, Cron & Automation
Save the commands you run all day, schedule them on real system cron, and wire FrontierStack into Apple Shortcuts, Siri and the rest of your Mac — from a one-click script to a hands-free voice command.
A good server administrator does the same handful of things over and over: run a backup, warm a cache, restart a backend the right way, check a vhost is actually serving what you think. FrontierStack lets you capture each of those as a saved script, run it with one click, and — when you trust it — hand it to cron so it runs unattended. From there it reaches outward, into Apple Shortcuts, Siri, the frontierstack:// URL scheme and scheduled actions the app performs on its own.
This chapter covers the mechanical side of automation: scripts, schedules and the macOS automation surfaces. The intelligent side — an AI that writes, saves and schedules these scripts for you — is Chapter 13. Everything here is something the AI Administrator can drive through its own audited tools, so the two chapters describe the same machinery from two ends.
12.1The Scripts & Cron pane
Open Scripts & Cron from the sidebar. It is your saved-script library and your scheduler in one place. The Saved Scripts section at the top lists every script you have kept, each with its name and the first line of its body. For each one you get four buttons: Run (execute it now), Schedule (hand it to cron, below), Edit (open the editor), and a trash icon to delete it. Press Add Script… to write a new one.
A saved script is a genuine executable file on disk — shell, PHP or Python — not a fragment the app interprets. Give it a clear name and a note describing its purpose, so that six months later (or the AI Administrator, scanning your library) can tell at a glance what it does and pick the right one. Because the saved file is exactly what runs, what you test by hand is exactly what runs on a schedule.
Each script can target This Mac by default, a local Docker container, or a linked server over SSH by name. Where a script needs a credential, it references a named secret from the local .env vault as an environment variable ($DB_PASSWORD, "$SSH_SUDO_PASS"); the app injects the real value at run time and never lets it reach a cloud model (Chapter 13).
12.2Scheduling with cron
The Cron Jobs section is a friendly front-end onto your real system crontab — not a separate scheduler the app invents, but the same cron that has run unattended work on Unix for decades. Each row shows a job's name, a plain-English description of its schedule (FrontierStack translates the five-field syntax for you), and the command it runs, with a switch to enable or disable it and buttons to Run it now, Edit it, or delete it.
Press Schedule on a saved script, or Add Job… for an arbitrary command, to open the schedule builder. Pick a cadence — hourly, daily at a time, weekly — and FrontierStack writes the crontab entry, tagging its own jobs with a # AC: comment so it can find and update them by name later. The same applies through the AI Administrator: list_cron reads your jobs, and schedule_cron creates or updates one (updating in place if a job of that name already exists).
For full control, expand Edit raw crontab at the bottom of the pane. This is the standard crontab in a text editor; FrontierStack-managed jobs appear as # AC: comments so you can see which lines it owns. Edit by hand and press Apply.
FS_TRIGGER, FS_LOCATION, FS_DEVICE, FS_DISK…) as environment variables. Cron handles time; triggers handle events.12.3The bundled sample scripts
FrontierStack ships a small read-only library of proven, battle-tested admin scripts. They are not your scripts — you cannot edit them in place — but you can read any one's full source, learn from it, and copy it into your own library to adapt. They encode real-world quirks of a Mac web stack (especially the old macOS Server backend), so reading one before writing your own saves you the surprises. The AI Administrator reads them first too, via list_sample_scripts and read_sample_script, so its scripts inherit the same hard-won knowledge.
| Script | What it does |
|---|---|
apache_real_docroot | Discovers the document root a vhost is actually serving — not what the config claims, but what Apache resolves at run time. |
apache_url_matrix | Reports the HTTP status for a list of paths on a vhost, tested over the real host header, so you can see at a glance which URLs are healthy. |
fleet_file_diff | Compares one file's checksum across your fleet to find configuration drift — where a machine has quietly diverged from the rest. |
macos_httpd_vhosts | Dumps the macOS Server backend's vhost → docroot map, so you can see exactly what that legacy stack is serving. |
macos_web_restart | Restarts the macOS Server web backend the right way — the correct sequence, not a blunt apachectl. |
node_healthcheck | A fleet drift / health check for one vhost across nodes. |
php_opcache_check | Reports OPcache status for both the CLI and the web SAPI, which are configured separately and easy to get out of step. |
12.4Apple Shortcuts, App Intents & Siri
FrontierStack ships native App Intents — actions that appear in the macOS Shortcuts app, in Spotlight, and (for several of them) as built-in Siri phrases you can speak. Drop them into a Shortcut you trigger from a hotkey, the menu bar or a Folder Action; they work from Automator too, since Automator can run Shortcuts and AppleScript. The shipped actions:
| Action | What it does | Built-in Siri phrase |
|---|---|---|
| Run Server Script | Runs one of your saved scripts by name. | — |
| Start / Stop Service Group | Starts or stops every service in your group at once. | “Start my servers with FrontierStack” |
| Restart Service | Restarts Apache, Nginx, MySQL or PostgreSQL. | “Restart a service with FrontierStack” |
| Restart Docker Container | Restarts a named container. | — |
| Get Local Health | Returns the Local Health summary (services up / down). | “Check server health with FrontierStack” |
| Apply Sidebar Preset | Switches the sidebar to a saved preset. | — |
| Flush DNS Cache | Flushes the macOS DNS resolver cache. | — |
| Send Notification | Sends a notification through your alert channels. | — |
| Ask Server Assistant | Sends a plain-English question to the AI Administrator and returns the answer into your workflow. | “Ask FrontierStack…” |
The catalogue is wider still — Get Server Status, List Servers, List Docker Containers, Check a Website and more are all available to build Shortcuts with, even where they carry no stock Siri phrase.
On macOS 15 and later, FrontierStack also places its servers, websites, mining rigs, Kubernetes clusters, saved scripts and sidebar presets in the Spotlight index (App Intents IndexedEntity). Siri and Apple Intelligence can then resolve “check the staging server” or “run my nightly backup script” to the right item, and each shows up in Spotlight with a live subtitle. Only what Shortcuts could already read is indexed — names, hostnames, OS and status, never credentials or notes — and the index is emptied while the app is locked or unlicensed.
12.5Driving the app from a script
Because the App Intents are real Shortcuts actions, you can call them from a shell step with the macOS shortcuts command-line tool — useful inside a saved script, a cron job, an Automator “Run Shell Script” action or any launcher. Wrap a FrontierStack action in a one-line Shortcut, then invoke it with shortcuts run "My Shortcut", chaining it with anything else your script does.
The AI Administrator can do this assembly for you. Ask it for an automation script that drives the app through Shortcuts and it calls list_app_intents to see the available actions and the exact shortcuts run invocation for each, then authors the script with save_script (or schedules it with schedule_cron). You get a finished, runnable script rather than a hint.
12.6Scheduled app actions
A cron job runs a shell command. A scheduled app action is different: it is a task the app itself performs on a schedule, using its stored credentials and the same audited tools you and the AI Administrator use — not a raw shell command. Use an app action to reboot a linked server, start, stop or restart a local service the app controls, or flush DNS on a timetable. They are managed through schedule_app_action and listed by list_app_actions, and they appear under Scheduled App Actions in the pane. The natural way to create one is to ask the AI Administrator — “reboot web-03 every night at 3am” — and approve it.
There is one important difference from cron: an app action only runs while FrontierStack is open. It performs the action through the app, so it catches nothing that falls due while the app is closed. Cron, by contrast, runs at the system level whether the app is open or not. Choose cron for things that must happen no matter what, and app actions for things the app must do with its own credentials and tools.
12.7The frontierstack:// URL scheme
Every pane, server, site, container and Cloudflare zone has a frontierstack:// deep link. From AppleScript, an Automator shell step, a launcher or any script runner, a single line such as open frontierstack://pane/Security brings the app forward and jumps straight to that pane. It is the fastest way to wire FrontierStack into an existing workflow when you want the app on screen at a particular place rather than running an action headless. The complete URL-scheme reference is in Chapter 18.
12.8Auto-export of backups, logs and the change-log
The last piece of routine automation is getting FrontierStack's own generated files off the Mac on a schedule. In the Backups overview, the Auto-export to a folder section copies generated artefacts to any folder you choose — a Dropbox folder for off-site safety, or a folder watched by Hazel to drive your own downstream rules. Three feeds are built in:
- Settings backup — a zip of your configuration backups, which also carry the sidebar pins, Setups, Locations and a copy of the app's preferences.
- Change-log — the running record of changes made through the app.
- App logs — a zip of FrontierStack's own logs.
For each feed you set an interval (hourly, 6-hourly, 12-hourly, daily or weekly), pick the destination folder, and optionally turn on Empty after export to rotate the source after each copy (handy for the change-log and app logs, so they do not grow without bound). Export now runs a feed immediately, and each feed shows its last result. Files land as FrontierStack-<feed>-<timestamp> in your chosen folder.
You now have the full mechanical toolkit: scripts you save and run, cron and app actions that run them on a schedule, Shortcuts and Siri that trigger them by hotkey or voice, a URL scheme that jumps anywhere, and auto-export that ships the results off-box. The next chapter introduces the operator who can author and wire all of this for you — the AI Administrator.
Chapter 13
The AI Administrator
A tool-using assistant that can see your servers, diagnose what is wrong, and fix it on your approval — with your secrets kept out of the model.
The AI Administrator — the AI Harness — is what makes FrontierStack more than a control panel. It is a tool-using assistant with a live, accurate picture of your setup. You describe a problem in plain English; it investigates with read-only diagnostics, explains what it found, and proposes a fix that you approve before anything runs. It works on this Mac and on every server you have linked over SSH, and it never sees your passwords. This chapter explains how it thinks, what it can do, and how to keep it safe.
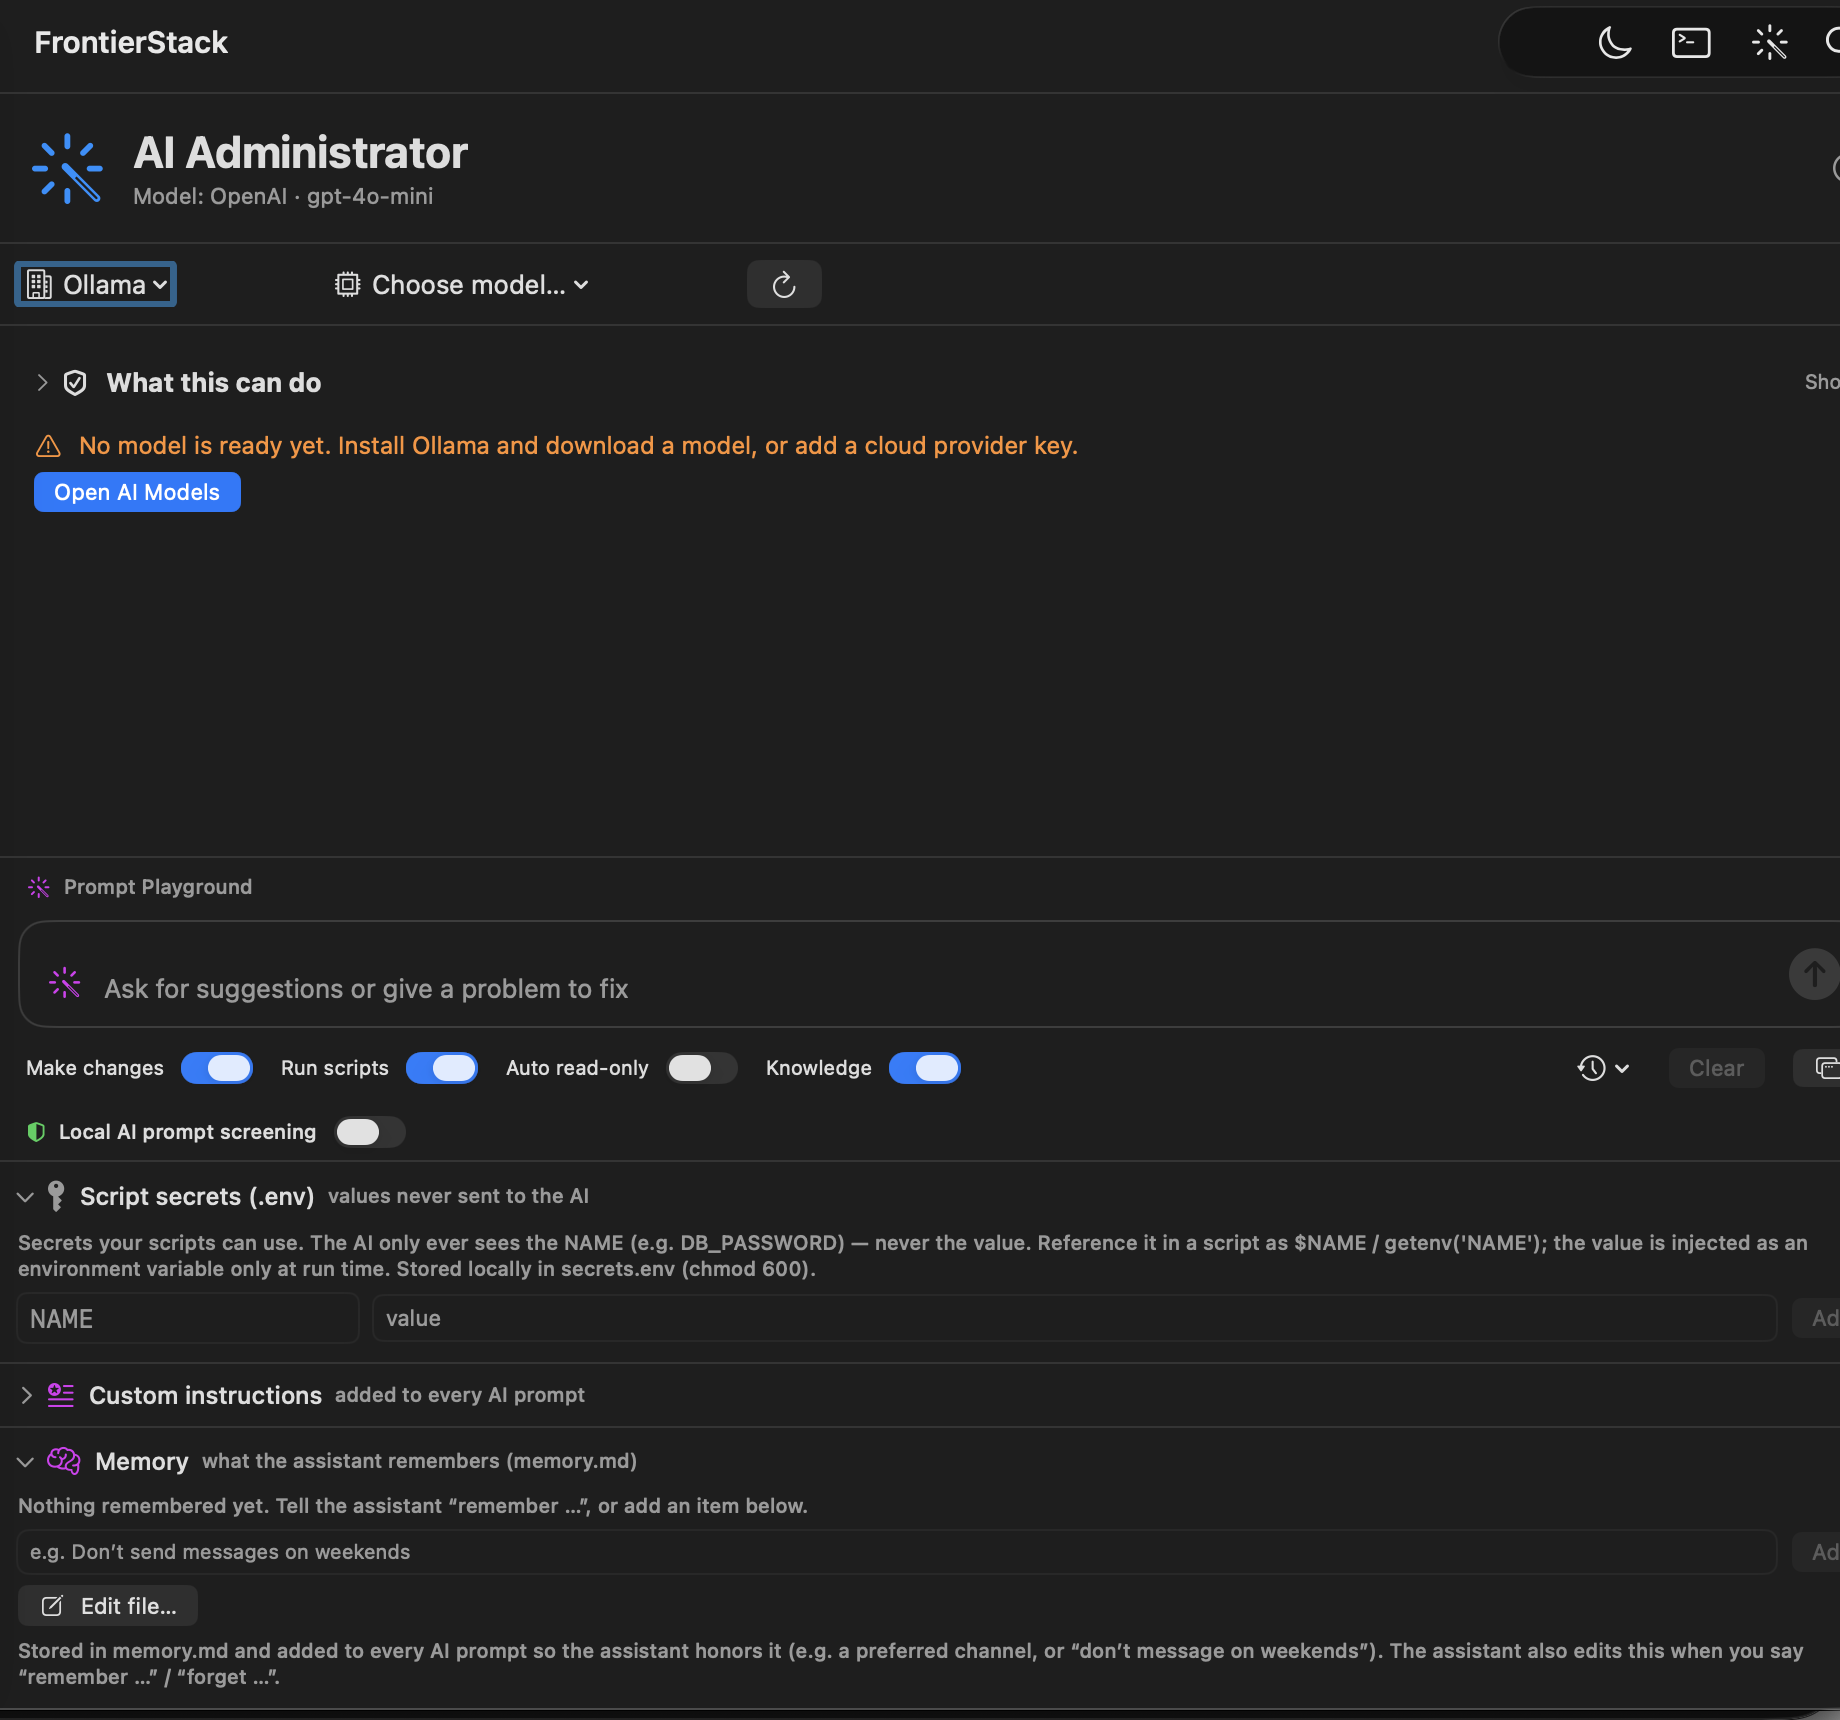
.env secret vault and long-term memory.13.1Choosing a model
The Administrator is not tied to one vendor. At the top of the pane you choose the model that drives it:
- FrontierStack AI — the default Harness engine when its zero-retention service is available. It needs no API key of your own and runs Qwen3 through Enfour's AI Cloud. Use of FrontierStack's AI servers is free for users for now and may become a paid service later. The upstream key and provider endpoint stay on Enfour's server; prompts are deterministically redacted before upload and the service must attest zero retention. Because this final Harness engine is already zero-retention, FrontierStack skips the separate cloud Prompt Firewall pass instead of sending the same text twice. Tool restrictions and approvals remain unchanged.
- A cloud model — the most capable option for hard diagnosis and multi-step work. You supply an API key (stored locally). With an OpenAI key, the picker offers GPT-6 Astra for the hardest work, GPT-6 Sol for complex coding and professional work, and GPT-6 Luna for focused high-volume tasks, plus the earlier GPT-5.6 family (Sol, Terra and Luna).
- Perplexity — add a Perplexity API key in AI Models, then choose Sonar, Pro Search, Deep Research or Advanced Deep Research. FrontierStack uses the Agent API, giving the Administrator web search, URL reading, source citations and its normal guarded tools. Model and research usage is billed to your Perplexity API account.
- A local model — Ollama, LM Studio, or any OpenAI-compatible server on your Mac (LocalAI, Jan, llama.cpp), plus Apple Intelligence: the on-device Foundation Model on Apple silicon with macOS 26, used natively or via Apfel (a one-command install the AI Models pane sets up, runs, and can start at login or app launch for you). Local models keep work entirely offline — nothing leaves the Mac, so the pre-send screening below isn't needed and is hidden. See Chapter 15 for running local models.
- Your own subscription tool over MCP — drive the whole app from Claude Code, Claude Desktop or Cursor on the flat plan you already pay for, with no per-token bill. This is covered in Chapter 14.
13.2Let a vision model inspect a pane
When a setting is visible in FrontierStack but the Administrator's tools cannot inspect that control, click Attach Screenshot… above the prompt. This is a model capability, not a Qwen-only feature: FrontierStack sends the appropriate image format to compatible OpenAI-style, Anthropic and local Ollama vision models. A custom or routed model whose capability is unknown can be tried, although its server may reject the image.
FrontierStack never captures your screen automatically. You select one image and review the exact prepared preview. The app limits it to 1,800 pixels, strips metadata by re-rendering it, and uses macOS text recognition locally to black out lines containing known stored credentials, personal account names, private fleet identities or secret-like tokens. OCR is defence in depth, not a guarantee: crop to the relevant pane and check the preview before sending.
13.3How a conversation works
You type a request the way you would brief a colleague — “why is the site throwing 502s?”, “check whether the certificate on shop.example.com is about to expire”, “restart Postgres on db-02”. The Administrator then works in a loop:
- It grounds itself. Before acting it discovers what you actually run — the service catalog, your linked servers and devices, the current health board — so its answers match your machine, not a generic guess.
- It investigates read-only. It reads logs, runs diagnostics, checks ports and certificates, and inspects config files. None of this changes anything.
- It explains, then proposes. It tells you what it found and, if a change is needed, shows the exact command or file edit it wants to run.
- You approve. Nothing that changes the system runs until you click approve on that specific action. It then runs the fix and re-checks to confirm.
You never have to wait for a turn to finish. Type another message while it works and it joins the running conversation at the assistant's next step — the Administrator reads your new instruction alongside its tool results and adjusts course mid-task, the way you would redirect a colleague. Messages that miss the turn are sent right after it, in order, and survive a Stop so nothing you typed is lost. And when a tool call hangs — an unreachable SSH host, a wedged service — press Skip beside the progress indicator: the assistant continues immediately and is told that tool may be broken, so it works around the failure instead of retrying into it.
13.4The trust model: read-only by default
This is the most important section in the chapter. The Administrator is built so you can hand it production servers without losing control.
| Setting | What it unlocks |
|---|---|
| (default) | Read-only. The assistant can look at everything — logs, health, config, diagnostics — but cannot change anything. |
| Allow changes | Permits mutating actions (restart a service, write a file, issue a certificate, open a firewall port). Each one still shows an approval card. |
| Allow scripts | Permits the general shell tool and saved-script execution. The script and a plain-English explanation are shown for approval before it runs. |
Two principles sit on top of these toggles:
- Per-action approval. Even with changes enabled, every mutating step is shown to you first — the actual command or diff — and nothing runs until you approve that action. There is no “approve everything” mode for ad-hoc changes.
- Remote actions need their own consent. Controlling a linked server through its monitoring helper additionally requires that server's own “Allow actions” switch, set in its Host Monitor pane (Chapter 8).
- Destructive database actions need a high-end model. Repairing, restoring or rebuilding a database is irreversible enough that FrontierStack hard-gates those steps to a frontier model — a small or on-device model can still read the log and diagnose, but is refused the destructive tool until you switch to a capable model (Claude Opus/Sonnet, GPT-4o/o-series, Gemini Pro).
DELETE, TRUNCATE, database/table drops, unscoped updates, file-removal and overwrite primitives, disk wipes, and destructive saved scripts, cron jobs or event triggers are refused before approval. Structured file writes preserve the previous file. vhost_remove disables one Apache/nginx vhost reversibly while preserving its document root. An intentional restore from a named backup remains available only through the separately gated local recovery workflow.13.5The secrets vault
Real administration needs credentials — a database password, an SSH sudo password, a Cloudflare token. FrontierStack keeps these in a local .env vault so the model never sees them.
You add named secrets in the Administrator's Script secrets (.env) bar — for example DB_PASSWORD, CF_TOKEN, SSH_SUDO_PASS. When the assistant writes a script that needs one, it references the name, not the value:
mysql -u root -p"$DB_PASSWORD" -e "SHOW DATABASES;"At run time the app injects the real value as an environment variable — locally, or over SSH on the target server — and injects only the names a script actually references. The model is told the secret names (so it can write correct scripts) but never the values, and command output is secret-redacted before it is sent.
- Shell:
$NAME/"$NAME" - PHP:
getenv('NAME') - Python:
os.environ['NAME']
PROD_DB_PASSWORD, STAGING_DB_PASSWORD, a per-server BALTHAZAR_MYSQL_PW. The assistant picks the name that matches the target; if the mapping is unclear it asks rather than guessing.13.6Import from a repo, and frontierstack run
Some developers keep their network settings in a repo for their agents — an SSH config, an Ansible inventory, .env files full of API keys. FrontierStack deliberately doesn't export credentials to a repo: a repo is copied to every clone, CI run and agent sandbox, and its history keeps a secret after the file is deleted. It does import one you already have.
Open Migrate Setups ▸ Servers ▸ Import from a Repo… (also in the Script secrets bar). Choose a folder, or paste a git address to clone it into a temporary folder that is deleted when the window closes.
| Found in the repo | Imported as |
|---|---|
SSH config: Host, HostName, User, Port, IdentityFile | Servers in the fleet; a key inside the repo is copied to ~/.ssh/frontierstack |
Ansible inventory (INI or YAML) with group_vars / host_vars | Servers with their environment (production, staging…); a become password becomes the server's sudo password |
.env, .env.*, .envrc | Script Secrets; well-known names such as CLOUDFLARE_API_TOKEN can also fill that service's own slot |
| SOPS, Ansible Vault, age, git-crypt files | Decrypted with your own tools and keys, in memory only |
Anything else (a routers.yml, Terraform variables) | Interpret with FrontierStack AI |
The AI step always uses FrontierStack AI's main model, and it never sees a value. Every secret-looking value is replaced by a placeholder such as ‹V7›; the model answers with placeholders, and the real values are filled in on your Mac only when you click Import. Show What the AI Sees… displays the exact text that is sent.
After the import, FrontierStack lists the files that are in the repo's git history, offers Replace Key for services whose API can issue a new one, and can save a .env.frontierstack reference file — names only, safe to commit:
DB_PASSWORD=fs://DB_PASSWORD
CLOUDFLARE_API_TOKEN=fs://CLOUDFLARE_API_TOKEN
Turn on Let frontierstack run use these secrets in the Script secrets bar, and your agents can run commands with the values without ever holding them:
frontierstack run -- ./deploy.sh
frontierstack run --secret API=CLOUDFLARE_API_TOKEN -- terraform plan
The values are injected as environment variables for that one command and masked in its output (--no-masking for interactive programs). It works with the app closed, respects App Lock, can't open secrets encrypted with a security key, and records each run — names only — in the change log.
13.7Prompt Firewall
Prompt Firewall is an optional semantic check on top of FrontierStack's always-on deterministic redaction. Choose On this Mac to use an Ollama or supported local OpenAI-compatible model, or explicitly choose Enfour's AI Cloud. It can warn and ask, automatically redact what it finds, or block the send.
On-device screening keeps the check entirely on this Mac. Enfour's AI Cloud receives only text after FrontierStack has removed known credentials, usernames, private addresses and secret-shaped patterns. It is free for users for now. The cloud service must attest zero retention on every response; if that assurance or the service disappears, screening returns an unverified result and Block mode stops the send. Enfour's upstream provider key and endpoint never reach the app, allowing Enfour to change the trusted provider later without distributing a new key or remotely configuring the app to call an arbitrary address.
13.8What the Administrator can do: the tools
The assistant acts only through a fixed set of audited tools. Each is guard-railed: read-only tools always work; mutating tools need the toggles above and an approval. Grouped by job:
| Area | Representative tools |
|---|---|
| Discover & ground | app_capabilities (what FrontierStack can manage), search_app_help (current Help for FrontierStack settings and controls), list_targets (servers & devices), get_server_health, get_location, get_sidebar_state |
| Diagnose (read-only) | diagnose (ping, dig, curl, netstat, df, ps…), read_logs/tail_log (incl. the Wi-Fi event log), get_location (with live Wi-Fi radio detail), security_audit, port_check, cert_expiry_check, whois_lookup, ip_analysis, metrics_snapshot, php_test/python_test |
| Control services | service_action (Homebrew services), repair_service, reload_webserver, restart_app, monitor_action (via a server's helper), reboot_host |
| Web & databases | list_sites/read_site_file/write_site_file, vhost_create/vhost_remove, list_databases/run_sql, db_dump/backup_now/restore, issue_certificate |
| Network & perimeter | firewall_rule, flush_dns, dns_record (Cloudflare), router_info (status, health & security signals), reboot_router, open_web_ui, discover_devices/pin_device, internet_speed |
| Mail security | email_auth_dns (SPF/DMARC/DKIM), harden_mail_postfix, test_open_relay, generate_dkim_key, install_mail_cert |
| Security testing | strix_status (read the Strix install, scan history & findings), strix_scan (run an authorised penetration test), strix_control (stop, re-run, restart, silence) — the two acting tools are local-only |
| Files & the shell | read_remote_file/write_remote_file/upload_file, and run_script — general shell on this Mac or any linked server |
| Scripts & schedules | list_scripts/run_saved_script/save_script, schedule_cron, schedule_app_action, list_sample_scripts |
| Messaging | get_messaging_channels, send_notification, get_alert_errors |
| Knowledge | list_skills/load_skill, list_notes/read_note, obsidian_search/obsidian_read_note, remember/list_memory/forget |
| The app itself | open_pane, set_pane_visible, manage_palette, set_services_visible — the assistant can navigate and reshape the sidebar for you |
The general-purpose run_script tool is the assistant's shell: anything the fixed tools do not cover, it does by writing a small, readable script and showing it to you for approval. On a remote server it works in two passes — a read-only test script to find the problem, then a minimal fix, then a re-test to confirm.
13.9Skills, notes and memory
Three features let the Administrator work from your knowledge rather than generic defaults.
13.12.1Skills
Skills are curated, multi-step playbooks — a fleet security audit, a web-stack restart procedure — managed in the AI Skill Manager. The assistant lists them cheaply (names only) and loads one's full instructions on demand, so a task follows your approved procedure instead of improvising.
13.12.2Notes shared with the AI
The Notes pane (Chapter 3) holds credentials, runbooks and instructions, each behind a per-note lock that is off by default. The assistant can read only the notes you have explicitly unlocked with Share with AI; it sees their titles to know what exists, and reads a body only when a task needs it.
13.12.3Long-term memory
Tell the assistant “remember that LINE is my preferred channel” or “never send messages on weekends” and it saves the rule to a durable memory.md so it honours it in future sessions. You can list and forget memories at any time.
13.12.4Knowledge Folder, Obsidian and Perplexity Brain
The Knowledge Folder pane accepts any local Markdown folder. FrontierStack keeps managed inventory, incidents, changes, SOPs, runbooks, prompts and recipes under its FrontierStack/ subfolder. Obsidian is an optional editor; installed vaults appear as shortcuts, but no Obsidian installation is required.
External models cannot read the full local folder. For Perplexity Projects and Brain, click Prepare Perplexity Folder. The generated Perplexity Export contains only a redacted inventory and capabilities by default, omitting addresses, MAC addresses, account names, credentials, private notes and journals. Sharing procedures or journals has a separate opt-in. Review the folder, attach it to a Perplexity Project, then enable Brain if your plan offers it.
13.10This Mac and your fleet
Almost every tool takes a target. Omit it and the tool runs on this Mac; set it to a linked server's name and the same diagnostic, log read, script or fix runs there over SSH (read-only tools stay read-only). So the same conversation can move fluidly from “check this Mac’s disk” to “now do the same on web-01 and edge-03”. Linking servers and the host-monitor helper are covered in Chapter 8.
Before privileged work, the harness reads a non-secret access status for the selected target. A linked server reports whether its SSH/root/sudo password is saved locally in FrontierStack's Keychain; only the fact that access is available reaches the model, never the value. This Mac reports whether the approved privileged helper is ready or whether a supported action will show the normal interactive macOS administrator-password prompt. When access is available, the assistant should try the bounded tool after your approval instead of stopping at instructions. Free-form AI scripts are not automatically given a server's saved password.
13.11Custom instructions and history
The Custom Instructions editor (Chapter 17) lets you shape the assistant's standing behaviour — house style, what to summarise, defaults you always want. Past conversations are kept in the history menu so you can return to an investigation, and the assistant can pick up where it left off.
13.12A worked example
To see the pieces together, here is a typical exchange — “the shop is down with 502s.”
The assistant callsget_server_healthand sees Apache up but PHP-FPM down on web-01. It reads the PHP-FPM log withread_logs(target web-01) and finds the pool failing to start after a config edit. It shows you the offending lines, proposes a one-line fix towww.confviawrite_remote_file, and — once you approve — reloads withreload_webserverand re-checks the site over loopback. Green. If you ask, it sends a one-line all-clear to your team withsend_notification.
Throughout, no password reached the model, every change waited for your approval, and the whole thing is something you could have done by hand — just faster.
Chapter 14
FrontierStack in Agentic Workflows
Use FrontierStack as the guarded infrastructure authority behind coding agents, autonomous coordinators and human/agent workflows — without moving server credentials into the model.
Chapter 13 covered the AI Administrator inside FrontierStack. This chapter covers the other direction: placing FrontierStack inside an agentic workflow you already use. Hermes Bots, Codex, Claude Code, Cursor, Gemini CLI, Grok-powered coordinators and other MCP clients can investigate your real fleet and request work through FrontierStack, while the credentials and final authority remain on the Mac.
14.1The role FrontierStack plays
An agentic system normally has a coordinator that decides what should happen and a set of specialists that know how to do particular work. FrontierStack fills one stable specialist role: Server Administrator. It is also the authority boundary between probabilistic model output and production infrastructure.
The distinction matters. A coding agent may understand a deployment and propose a restart, but it should not carry the SSH key that makes the restart possible. A manager agent may assign an incident, but its message is not authorization. FrontierStack accepts the request, authenticates the caller, narrows the tool set, applies local policy, resolves credentials at execution time, asks a person when required, acts, verifies the observed result and records who requested it.
14.2One request, end to end
- The coordinator describes a bounded job. For example: “investigate certificate failures on web-02” or “restart the queue worker if it is stopped”.
- FrontierStack authenticates the caller. A local client uses the owner-only Keychain bridge. A network caller must use the explicitly enabled, paired, signed and scoped path.
- Tool discovery is filtered twice.
frontierstack_find_toolsfinds tools relevant to the assignment, then the caller’s current scope removes anything it may not use. - Policy is applied at execution. Read-only defaults, App Lock, destructive-data restrictions and approval cards are checked again when the chosen tool is called. Discovery never grants permission.
- Credentials are resolved locally. SSH keys, sudo passwords, database credentials, router logins and cloud tokens stay in the Keychain or linked vault. The model receives neither the value nor a reusable credential-bearing command.
- The target performs a bounded operation. FrontierStack acts on this Mac or the selected Linux, Windows or Mac host through its reviewed local, SSH or helper path.
- Completion is verified. A successful process exit is not enough for important changes. FrontierStack checks the app-observed postcondition, writes the audit event and returns an attributable result or durable receipt.
14.3Choose an agentic workflow pattern
The usual starting point is interactive MCP from a coding agent. Add durable tasks, events or mobile supervision only where the workflow needs them.
Integration surfaces
| Team shape | Use | What FrontierStack provides |
|---|---|---|
| A coding agent or manager needs a bounded server operation | MCP (recommended) | Live, caller-filtered tools and resources through the existing local policy and approval boundary. |
| A shell script, local automation or CI runner needs a stable interface | FrontierStack CLI | Machine-readable discovery and the same guarded calls as MCP, with credentials supplied by the owner-only Keychain bridge rather than copied into scripts. |
| An agent needs a map of the fleet before it connects | Agent Skill / AGENTS.md | A portable, credential-free description of servers, roles, services and operating rules. |
| A coordinator delegates long work or hands over an incident | A2A 1.0 preview | A durable task ID, progress, cancellation, input or approval-required states, artifacts and a terminal receipt. It is private and off until enabled. |
| An MCP client supports deferred work | MCP Tasks preview | The same durable task engine projected through the experimental Tasks extension. Both sides must opt in. |
| An incident or CI/CD system raises work | CloudEvents preview | Selected authenticated events can start read-only triage and carry correlation information. An event never grants permission to make a change. |
| An operator needs to supervise agents away from the Mac | iOS Agent Activity | Bounded status, runtime, job and durable-session metadata from the paired Mac, without copying prompts, transcripts, terminal contents or credentials to the phone. |
Keep the tool list small
Do not load FrontierStack’s complete tool catalog into every model conversation. Some AI harnesses impose a 128-tool ceiling, and a long irrelevant catalog also makes tool choice less reliable. FrontierStack’s default catalog therefore exposes a small bootstrap pair: frontierstack_find_tools finds only the tools relevant to the current task and caller, and frontierstack_call invokes the selected tool. Use frontierstack tools --full only for inspection or a client that explicitly needs the complete permitted catalog.
Install a credential-free setup kit
In the MCP pane, export an Ecosystem Setup Kit, or read frontierstack://ecosystem-kits over MCP / run frontierstack ecosystem-kits. The generated recipes cover OpenClaw/Hermes-style specialists, Buzz or other human/agent teams, OpenAI-style managers and handoffs, Microsoft workflows, LangGraph, CI/CD, Slack/Teams approval handoffs and a generic future adapter. A kit contains role and endpoint metadata, instructions and safe placeholders — never a password, private key, bearer token or API key.
- Choose the recipe closest to the coordinator you use and give FrontierStack the Server Administrator role.
- Connect through localhost, or through FrontierStack’s paired HTTPS path when the coordinator is on another approved device. Do not publish the local MCP port directly.
- Start read-only. Test discovery, fleet health and help/manual search before enabling any changes.
- When a change is needed, approve the exact action in FrontierStack. A message in a group chat, an agent card, a prompt or a claimed approval is not authorization.
- Use the task view to follow progress, cancel work and retain the final verification receipt.
The trust boundary does not move
- Credentials remain local. Server passwords, SSH keys, AI keys and vault values are resolved at execution time and are not exported to the coordinator, setup kit, remote helper, callback or model prompt.
- Discovery is not permission. A role profile, Skill, event, chat identity or tool description says what FrontierStack may be able to do; it cannot enable a tool or widen a caller’s scope.
- Changes pass one gate. MCP, A2A, the CLI and events all use the same App Lock, per-caller scope, destructive-data guardrails, local approval and audit trail.
- Remote helpers stay constrained. The monitor/helper on a server is FrontierStack’s deterministic hands and eyes. It does not host a model, store AI-provider credentials or accept arbitrary MCP work from the network.
- Completion means verified. Durable mutating tasks finish only after FrontierStack records an app-observed postcondition, not merely because a command returned zero.
Observe agents without exposing their work
The Mac’s Agent Operations view is the operational console for worker-host reachability, detected runtimes, active jobs and durable terminal sessions. The iPhone and iPad companion’s Agent Activity view presents a deliberately smaller status surface from the paired Mac. It can show which workers are reachable and which jobs or sessions are active, but it does not send prompts, transcripts, command lines, environment variables, terminal contents or credentials to the phone.
For long-running work on Linux and other fleet hosts, Servers › Host › Terminal Sessions inventories tmux, GNU screen and Zellij sessions. A phone with the required scope can open a direct SSH terminal and attach to a selected session; ending one is a separately confirmed full-control action.
14.4Enabling the MCP server
FrontierStack can discover the common AI clients installed on the Mac and configure its own MCP entry without exposing a reusable credential:
- Open the MCP Server pane. The server is on by default and binds to
localhost; you can turn it off there. - Review Detected AI clients. FrontierStack recognizes Amp, DeepSeek Harness Alpha, Hermes Bot Mode, Grok, Codex CLI, Cursor, Gemini CLI, Claude Code, Claude Desktop and Xcode (26.3 and later). Use Set Up Detected, or configure one client from its individual control.
- Amp setup runs
amp mcp addand adds only FrontierStack's owner-only local bridge. It does not enable Amp remote thread creation, start a runner or expose a remote-control terminal. - DeepSeek Harness (Alpha) uses a configuration-only plugin bundle for the Harness
webprofile. It activates Harness's own MCP client and points it at FrontierStack's owner-only bridge. The bundle contains no bearer token, server credential, DeepSeek key or network endpoint. Because DeepSeek Harness is still a developer preview, FrontierStack does not install or repair this Alpha plugin at launch; choose Add Alpha Plugin explicitly and update it with FrontierStack when the supported Harness release changes. - Hermes stores each Bot as an isolated profile. Automatic setup repairs only Hermes’ main profile; Set Up Bots is a separate, explicit opt-in for the existing roster. Hermes records the bridge as
untrusted, and FrontierStack still applies its read-only default, change and script switches, App Lock, approval and audit rules. - Enable Set up detected AI clients at launch if FrontierStack should repair only its own
frontierstackentry whenever a stable detected client changes. Other MCP entries are preserved, and Alpha integrations are skipped. - The generated entry launches FrontierStack’s owner-only bridge. The bridge retrieves the MCP credential from Keychain when it starts; the bearer token is not serialized into the client’s configuration.
- For another stdio MCP client, install the FrontierStack CLI and use the command returned by
frontierstack mcp. - Start read-only. Run
frontierstack discover, list fleet health and try a help search before allowing changes or scripts.
14.12.1Xcode
Xcode 26.3 and later (including Xcode 27 on macOS 27) hosts coding agents and speaks MCP in both directions. Add to Xcode writes FrontierStack’s owner-only bridge into ~/Library/Developer/Xcode/CodingAssistant/mcp-servers.json, the list of MCP servers the Claude, Codex and Gemini agents inside Xcode may use. An agent working on your app can then ask FrontierStack about the server, database or site it is targeting, and request bounded work under the same read-only default, change switch, approval and audit rules as any other client.
In the other direction, the AI Administrator’s xcode tool talks to Xcode’s own MCP server through xcrun mcpbridge: list schemes and targets, build, run all or some tests, read the build log, render a SwiftUI preview, search or edit project files, create a project from a template and drive a simulator. Turn on Xcode › Settings › Intelligence › Model Context Protocol › Allow external agents to use Xcode tools and keep the project open; Xcode shows an alert when FrontierStack connects. Xcode’s read-only tools run freely, while builds, test runs, edits and scheme switches require Allow changes. For a project that is not open in Xcode the tool runs xcodebuild in the in-app console instead. Do not run both against the same project at once: two builders can corrupt Xcode’s build database. The pane also shows the claude mcp add … xcode -- xcrun mcpbridge command that gives Claude Code the same Xcode tools.
14.12.2Grok Bot
Choose Add to Grok to add FrontierStack’s owner-only bridge to ~/.grok/config.toml, or export the project kit when one repository should carry its own Grok instructions. The bridge reads the MCP credential from Keychain at runtime; the TOML file contains no bearer token. Keep a local Grok workflow read-only until its health and help calls behave as expected. A cloud Grok Bot cannot reach the loopback listener. Remote use requires the TLS-protected network path, a paired caller identity and an explicit scope. Never solve discovery by copying the bearer token into bot memory or a project file.
14.12.3SlackBot, Slack handoffs and Buzz
Slack support has three separate parts. The Messaging Gateway sends alerts through a Slack incoming webhook. The ecosystem kit describes a Slack or Teams handoff for an existing bot workflow. Full Fleet also includes the Slack Server Admin Agent Beta, which lets FrontierStack itself join the workspace as a server-administrator teammate.
In Messaging Gateways, copy the supplied private Slack app setup, install it to the workspace, and save the xapp- Socket Mode token and xoxb- bot token in Keychain. No public inbound endpoint is opened. Mention @FrontierStack in an invited internal channel or message the app directly. Replies stay in the Slack thread, carry bounded thread context, and can use the AI Harness with FrontierStack's server, service, network, monitoring, and installation tools.
FrontierStack verifies that the requester is a full member of the connected workspace and refuses guests and Slack Connect conversations. An optional channel-ID list narrows the scope further. Read-only investigation is the default. If an owner enables change requests, the model can select only typed FrontierStack actions; credentials, arbitrary shell, recovery secrets, and self-administration remain unavailable. Every change still passes the Full Fleet gate, App Lock, External changes policy, local approval, audit, task receipt, and outcome verification. A Slack message, reaction, role claim, or button is never approval.
Buzz is a service integration and a team-recipe target. FrontierStack can install or connect the hosted or self-hosted Buzz stack and monitor its relay and dependencies. The exported Buzz-style kit describes scoped human and agent roles and selects an existing MCP, A2A, CloudEvents or CLI route. It is not a live Buzz agent endpoint, and it contains no Nostr key, server credential or FrontierStack bearer token.
The installed frontierstack CLI also uses stateless MCP by default. Run frontierstack discover for machine-readable protocol and capability information; frontierstack info reports both the preferred stateless revision and the supported legacy revisions.
An unfamiliar client can read the frontierstack://manual resource or call search_app_help to learn app-authored procedures without exposing arbitrary files.
The separate MCP Servers pane can manage other servers in either generation. Its Automatic setting tries server/discover first and falls back to legacy initialize only when necessary. A green Stateless mark appears in the server list only after the HTTP server proves support; a stateless stdio server can be marked explicitly because the external client owns that process and handshake.
For example, the AppSignal preset connects to AppSignal’s hosted MCP endpoint through a reviewed, version-pinned mcp-remote bridge. The bridge performs AppSignal’s browser OAuth flow, so no AppSignal token is placed in the preset, client configuration or process arguments. This agent connection is separate from FrontierStack’s deterministic AppSignal health monitor: use the personal API token and app ID in the AppSignal service pane for Local Health and alerts, and use OAuth MCP only when an agent needs a deeper investigation. Start with read-only AppSignal access and review any write-capable tool before delegation.
14.5Setting up FrontierStack for agent platforms
An agent platform can use FrontierStack in one of three ways. A coding agent calls it as an MCP tool server, as described in the previous section. An orchestrator can employ it as a worker that takes assignments: a Paperclip heartbeat or an A2A task. And any agent that has a shell can drive the frontierstack CLI. Whichever route you pick, FrontierStack plays the same Server Administrator role, and the same App Lock, read-only default, approvals and audit log apply.
| Platform | How it connects | Where to set it up |
|---|---|---|
| Claude Code, Codex CLI, Cursor, Gemini CLI, Claude Desktop, Amp, Grok, Hermes, Xcode | MCP, through FrontierStack’s owner-only local bridge | MCP Server ▸ AI clients ▸ Set Up Detected |
| OpenClaw | MCP through the local bridge, added with OpenClaw’s own openclaw mcp add, plus the FrontierStack skill in ~/.agents/skills | MCP Server ▸ AI clients ▸ OpenClaw ▸ Add to OpenClaw |
| Buzz | Its local agent (Claude Code, Codex or goose) uses that harness’s MCP entry and reads the skill from ~/.agents/skills | Set up the harness Buzz runs, then Add to OpenClaw or export the skill to ~/.agents/skills |
| Claude Code (fleet context) | The Fleet Skill, ~/.claude/skills/fleet/SKILL.md | Fleet Skill, with auto-update on (see below) |
| Paperclip | FrontierStack is hired as a company agent; Paperclip’s process adapter runs it once per heartbeat | Paperclip pane ▸ Work as a Paperclip agent |
| OpenClaw, Hermes supervisors, LangGraph, Microsoft and OpenAI-style managers | A2A 1.0 delegation, or the matching ecosystem kit | MCP Server ▸ Accept delegated A2A tasks; Ecosystem Setup Kit |
| CI/CD, shell scripts, n8n, any agent with a terminal | The frontierstack CLI, or CloudEvents for incident triggers | MCP Server or Remote Control & Lock ▸ Command Line ▸ install the CLI |
| ChatGPT, Codex, and cloud assistants that take a custom MCP connector (such as a cloud Grok Bot) | The FrontierStack plugin at https://frontierstack.app/plugin/mcp: sign in with your FrontierStack account; this Mac answers over an outbound connection | MCP Server ▸ ChatGPT access (the app must be running) |
| Other cloud agents (Devin, Manus) | Only the paired, TLS-protected network path with a scoped identity | Signed requests and device pairing (next section) |
14.12.4Paperclip: hire FrontierStack as the company’s system engineer
Paperclip runs a team of agents as a company, with an org chart, budgets, goals and approvals. FrontierStack can join that company as its system engineer and network administrator. It takes the infrastructure issues assigned to it, investigates them with its own tools and reports back on the issue.
- Install Paperclip on this Mac, as your own user:
npx paperclipai onboard --yes. Heartbeats run FrontierStack locally, so Paperclip can’t live on another machine. - Open the Paperclip pane in the Agent Operations section. Under Connection, check the endpoint (
http://127.0.0.1:3100by default). If Paperclip runs in authenticated mode, paste a board API key as the token. - Under Work as a Paperclip agent, turn on Accept Paperclip heartbeats and click Install heartbeat command. This writes
~/.frontierstack/bin/frontierstack-paperclip. - Open Hire FrontierStack into a company, click Load companies, choose the company and click Hire as DevOps agent. This creates an agent titled “System Engineer & Network Administrator” that uses the
processadapter. You can instead click Copy adapter config and paste it into an agent you create in Paperclip yourself. - Assign it an issue in Paperclip, for example “find out why mail from web-02 is bouncing”. Its progress appears in Paperclip’s run transcript.
On each heartbeat, Paperclip runs the heartbeat command with a short-lived run token. If FrontierStack isn’t running, the command starts it hidden in the background (a cold start can take up to two minutes). FrontierStack then checks out the assigned issue, investigates, comments and sets the issue to done, blocked or in review. If another agent already has the issue checked out, FrontierStack leaves it alone. The run token is sent only to the Paperclip server set in the pane.
Let Paperclip request changes is off at first, so the agent only investigates and recommends. When you turn it on, each typed change still follows App Lock and your External changes setting: it runs, waits in the pane with Approve once, Allow for 5 minutes and Deny, or is refused.
14.12.5A2A supervisors and manager agents
A coordinator that speaks A2A 1.0, such as an OpenClaw or Hermes supervisor or a LangGraph manager, can hand FrontierStack a durable task instead of calling tools one at a time. In the MCP Server pane, turn on Accept delegated A2A tasks (off by default). An agent on this Mac connects over localhost. An approved remote coordinator uses the paired, certificate-pinned HTTPS route. The Agent Card only describes FrontierStack; it grants nothing. A natural-language assignment is always read-only. A change must be sent as a typed FrontierStack request, and it then passes the usual scope, App Lock, approval, audit and verification checks. Progress streams over SSE, and optional callbacks must go to public HTTPS addresses. Export the matching Ecosystem Setup Kit for a ready-made, credential-free recipe.
14.12.6Agents with a shell, CI and scripts
Install the CLI from the MCP Server pane or Remote Control & Lock ▸ Command Line. An agent can then run frontierstack discover to see what’s available, frontierstack role to read the Server Administrator profile, and frontierstack call <tool> '<json>' to run a tool. Give it credentials with frontierstack run (see Credentials for agents), never by pasting them into the prompt. If the platform works on a schedule or at night, turn on the background service so read-only checks work with the app closed (Working with the app closed).
14.12.7Before a platform makes changes
- Connect it read-only first. Check discovery, fleet health and a help search.
- Give Claude Code the Fleet Skill so it knows your servers before it connects, and turn on auto-update so the skill follows fleet changes.
- Turn on changes per platform: the MCP change switch, Let Paperclip request changes, or typed A2A requests. Keep approvals on the Mac or the paired iPhone.
- Watch the work in Agent Operations ▸ Activity and the audit log. The iPhone’s Agent Activity view shows status without copying prompts or transcripts.
14.6Signed requests and device pairing (FS1)
The control and MCP servers add a per-device signed-request layer — FS1 — on top of the bearer token and TLS. Each paired device holds its own Ed25519 private key and signs every request; FrontierStack verifies the signature against the device you approved, so a leaked token alone cannot drive anything.
- Per-device scopes. Each device is granted a scope from read-only up to full control, set on the Mac.
- One-tap revoke. Remove a device and it is cut off instantly, without affecting the others.
- This is the same mechanism the iPhone and iPad app uses to pair — see the Mobile Manual, and the trust model in Chapter 10.
14.7External AI jobs
Beyond live MCP, FrontierStack can hand a job to a subscription AI CLI — package up a task and let your local Claude (or similar) work it under your plan, then bring the result back into the app. This is how heavier, longer-running analysis runs without a metered API bill, and it pairs with the Data Map (a per-location data-flow diagram) so the agent has the context it needs. External AI jobs are managed from the AI stack (Chapter 15).
14.8Skills, notes, memory and Obsidian over MCP
An external harness reaches the same knowledge surfaces as the built-in Administrator, subject to the same gates:
- Skills — your curated playbooks are discoverable and loadable on demand.
- Shared notes — only notes you unlocked with “Share with AI” are readable.
- Long-term memory — the same
memory.mdof preferences and standing rules. - Obsidian — if you have linked an Obsidian vault, the agent can search your SOPs and runbooks and follow the documented procedure (Chapter 12).
14.9The Fleet Skill — portable context for any agent
The MCP server lets an agent act on your fleet. The Fleet Skill is the other half: static context that teaches an agent your world before it touches anything. The Fleet Skill pane generates a SKILL.md — your servers and their roles, OS, services and how to reach them; your network locations; your KVMs and power sources; and a free-text block of your own rules and preferences — with every secret stripped out. An agent that reads it picks the right host, uses the right path, and respects your conventions instead of guessing.
It is written to ~/.claude/skills/fleet/SKILL.md, which Claude Code discovers automatically — the description: in its frontmatter tells the model when the skill is relevant. MCP-connected agents can pull the same content through the get_fleet_context tool, and you can optionally also emit ~/AGENTS.md for CLIs that read that convention. Turn on auto-update and the skill is rewritten a few seconds after your fleet, locations or KVMs change, so it never drifts from reality.
Think of it as the difference between a map and a remote control. The MCP is the remote control — live, authenticated, able to do things. The skill is the map — zero-setup, portable, safe to hand to any agent, and the thing that stops a capable tool from doing the wrong thing in the right way.
14.10Credentials for agents, without a .env
Agents often need an API key or a password to run a command. Don't paste it into the chat, and don't keep it in the repo. Put it in Script Secrets (AI Administrator ▸ Script secrets bar), turn on Let frontierstack run use these secrets, and let the agent run:
frontierstack run --secret CLOUDFLARE_API_TOKEN -- terraform applyThe value is set as an environment variable for that one command and masked in its output, so the agent sees the command work without reading the value. A project can instead commit a .env.frontierstack of names only (DB_PASSWORD=fs://DB_PASSWORD); frontierstack run -- <command> in that folder fills it in. The agent guide, the exported skill and the Fleet Skill all tell agents to work this way. Already keep credentials in a repo? Import from a Repo… moves them in (Ch 13).
14.11Working with the app closed
FrontierStack does not have to stay open for agents to use it. Keep MCP and the CLI available when FrontierStack is closed is on by default (MCP Server pane, or Remote Control & Lock ▸ Command Line). A small background service then starts when you log in and owns the local MCP and CLI ports (8788 and 8799 by default). With the app closed, it answers discovery and a set of read-only checks itself: WHOIS, IP analysis, certificate expiry, port checks, the open-relay test, disk usage, top processes, a metrics snapshot, reading hosts files and remote files, and MySQL/PostgreSQL table checks, on this Mac or on your saved servers. For anything else it starts FrontierStack hidden and passes the request on. While the app runs, every request goes straight to it, so App Lock, approvals and the audit log behave exactly as before.
| Setting | What it adds while the app is closed |
|---|---|
| Keep MCP and the CLI available when FrontierStack is closed | MCP and frontierstack keep answering; read-only checks run without the app, and everything else starts it hidden. |
| Keep monitoring while FrontierStack is closed | Your watches, mail endpoints, TLS certificate and domain renewal dates, and linked servers keep being checked. Alerts go out through your channels. Only one side checks at a time, and the app takes over when it opens. |
| Let headless agents work while my security key is plugged in | With a security-key App Lock, read-only checks run while one of your enrolled keys is plugged in, and frontierstack run can open Script Secrets sealed to the key. |
Check what is answering with frontierstack info ("answering": "app", "core" or "none") and frontierstack headless status. The service starts at login, not at boot. Turn on Automatic login in Headless Mac Setup if MCP should come back by itself after a restart or power cut. After an app update the service restarts itself on the new version once open requests are done. Paired iPhones and iPads keep reaching the Mac through the service, with no re-pairing: from the phone's dashboard, Start FrontierStack on the Mac starts it hidden and Open FrontierStack on the Mac opens its window. Alert pushes to the phone keep arriving while the app is closed.
frontierstack run unless you turn that off, which also takes a touch. A key with a PIN can open sealed secrets only in the app. Changes always go to the app. frontierstack headless key shows whether an enrolled key is plugged in and answering.14.12When to use which
| Use… | When… |
|---|---|
| The built-in AI Administrator (Ch 13) | You want everything in one window, including the approval cards and the cost monitor, and you are happy to supply a model/key or run locally. |
| FrontierStack over MCP (this chapter) | You already live in Amp, Claude Code or Cursor and want one guarded path for code and servers. |
| External AI jobs (Ch 15) | The task is heavy or long-running and you want it handed to a subscription CLI rather than run interactively. |
All three reach the same guarded tools and the same live app state. Pick by where you prefer to work; the safety guarantees do not change.
Chapter 15
The AI Stack
The other side of AI: not the assistant that runs your servers, but the AI infrastructure your servers run — agent runtimes, local models, sandboxes, GPUs and the bill for all of it, watched from one window.
The previous two chapters were about AI operating FrontierStack: the built-in Administrator (Chapter 13) and driving the app from your own tool over MCP (Chapter 14). This chapter is the reverse. It covers the AI infrastructure FrontierStack helps you run and monitor — agent platforms, local model servers, code sandboxes, browser automation, GPU fabric, ML tooling, governance, and the cost of all of it. These are services in the catalog like any other, grouped under the AI categories in the sidebar, but they deserve a chapter of their own because running AI is now a stack you operate, not a box you call.
15.1Agent Operations
Open Agent Operations from the sidebar for the server-first view of agent work. Every fleet host appears with reachability, environment, CPU and memory, detected agent workers, and buttons for host details and a contextual shell. The shell is local for this Mac and follows the host's configured SSH, mosh or SSH3 trust settings for remote boxes. Runtime health, local coding-agent processes, FrontierStack sessions and agent containers remain on the same board. The AI tool get_agent_platforms exposes runtime state to the Administrator, so you can ask "which agent runtimes are down?" in plain English.
The runtimes fall into two kinds. Some are CLI runtimes — detected by their command-line tool being installed and answering --version. These include Amp, DeepSeek Harness Alpha, Claude Code, Gemini CLI, OpenAI Codex and Factory's droid. Others are HTTP runtimes that expose a status endpoint and are polled for live metrics. A handful of cloud agent products (OpenHands, Manus, Devin, OpenAI Operator, E2B) appear lower down as catalog entries you connect rather than poll.
| Platform | What it is |
|---|---|
| OpenClaw | Self-hosted agent runtime, monitored for running state and model. |
| Hermes | Agent runtime polled over HTTP for status, model and sessions. |
| DeerFlow | Deep-research / multi-step agent runtime. |
| Paperclip | Runs a team of agents as a company (org chart, budgets, goals, approvals); port 3100. The pane counts companies and agents; add a board API key in authenticated mode. Work as a Paperclip agent (beta): install the heartbeat command and hire FrontierStack into a company as its system engineer and network administrator. Changes still need approval in FrontierStack. |
| LangGraph Platform | Graph-based agent orchestration; status and model surfaced on the board. |
| CrewAI Enterprise | Multi-agent "crew" runtime. |
| Microsoft AutoGen | Multi-agent conversation framework. |
| Genspark | Autonomous agent platform. |
| Agent Zero | General-purpose autonomous agent. |
| NVIDIA NemoClaw | NVIDIA agent runtime. |
| OpenAI Codex / Claude Code / Gemini CLI / Factory Droid | Coding-agent CLIs; detected by install + version, shown as on-demand. |
| Amp | Coding-agent CLI and headless runner. FrontierStack detects its version locally or over SSH and marks hosts with a running Amp process. |
| DeepSeek Harness (Alpha) | DeepSeek's plugin-based developer-preview agent harness. FrontierStack detects the dsh CLI and running jobs locally or over SSH. Its optional FrontierStack plugin is installed explicitly from the MCP pane. |
| Unreal Agent | Unreal Labs' open-source, async-first agent harness: tool calls run in the background while the model keeps working. Works with OpenAI, Codex, OpenRouter, Fireworks or Ollama. Install it with go install (Go 1.27+). FrontierStack detects unreal-agent-runner locally or over SSH and marks hosts where it is running. |
Because configured runtimes feed the broader system, a runtime that goes down — or hits a token quota (rate-limit, 429, billing) — raises an Alert and appears red on the Local Health board, in the services group. You configure each runtime's endpoint and credentials once; from then on it is watched like any other service.
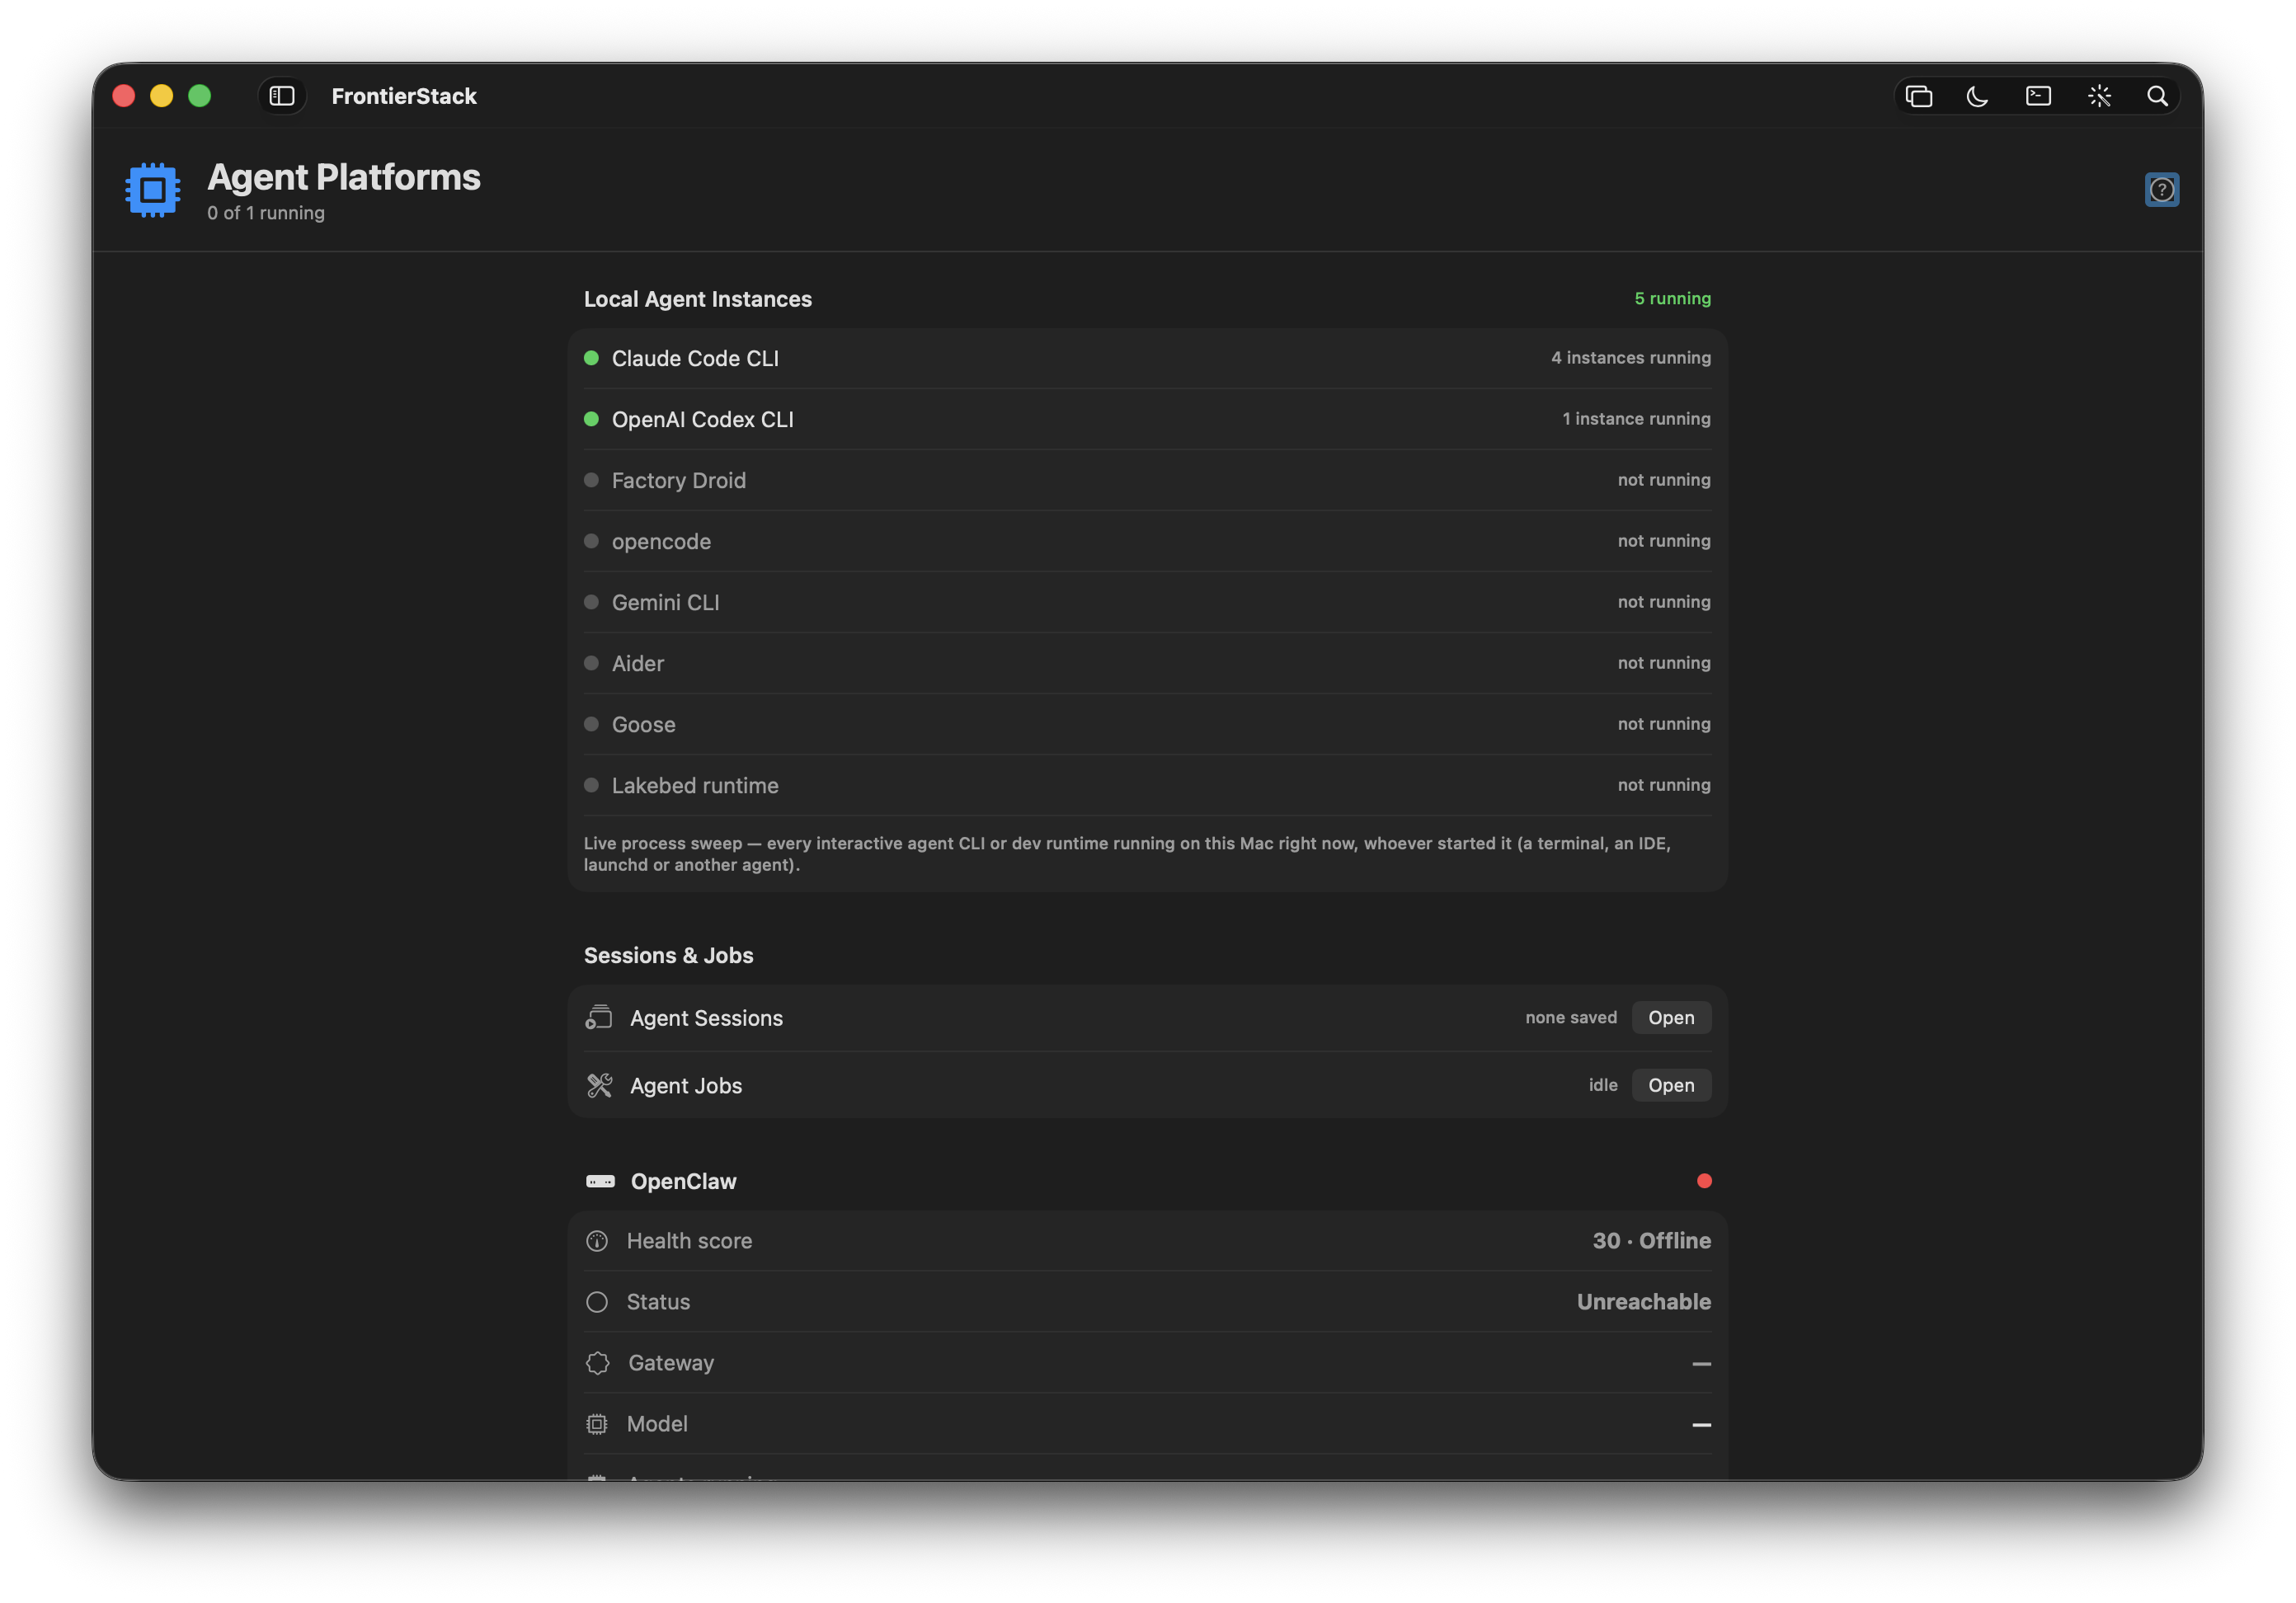
15.2Activity, Work, Runtimes & Routing
Four companion views break the agent fleet down by operator task, all reading the same live state:
- Activity — the bell-shaped operator inbox. Needs You collects runtime failures, lost workers and failed sessions/jobs; Running shows current work; Recently Finished is a short run ledger. The toolbar bell opens it from anywhere.
- Work — three tabs for the runtime queue, goal-driven Administrator sessions, and isolated Codex/Claude sandbox jobs. OpenClaw cron jobs, paused state, tokens and one-shot job status remain visible in Queue.
- Runtimes — every configured local/HTTP engine, detected T3 Code worker, and cloud agent product, with reachability or credential state.
- Routing & Integrations — model routing/provider keys and repository access in two tabs. GitHub, GitLab, Bitbucket and Cursor Origin credentials stay in the Keychain and receive a live API check.
Agent runtimes and connectors authenticate with credentials you save once. Like everywhere in FrontierStack, those tokens live in the macOS Keychain, never in the app's settings file and never sent to a cloud model.
15.8.1Cursor Origin (Early Beta)
Version Control ▸ Cursor Origin is a live dashboard for Cursor's Git forge. Enter the codebase name shown at cursor.com/codebase. FrontierStack lists up to 30 repositories and the open pull requests in the first 12. Repository rows open in Origin. The preferred personal login is Cursor's own origin auth login; FrontierStack calls origin api and never receives the user credential. For automation, the same pane and Repository Connectors can use a service-account API credential or a short-lived Origin installation token from the Keychain.
oit_ and expire within 15 minutes. An Origin App installation cannot access a repository mirrored into Origin from GitHub, so use FrontierStack's GitHub connector for that repository. Review the connector after Cursor API or CLI updates.repository:contents:read until the agent must push, then add repository:contents:write only for the selected repositories.15.3Work sessions, T3 workers & the built-in terminal
Work ▸ Sessions is the manager for goal-driven ops and SaaS loops you build yourself — one-shot or recurring. A session has a plain-English goal, title, step budget, and a switch for whether it may make changes. Each session drives the same guarded tools as the Administrator (Chapter 13) and streams every step to a transcript you can stop at any time; scripts are never permitted from a session loop.
FrontierStack identifies a T3 Code worker only when 127.0.0.1:3773/.well-known/t3/environment returns a valid environment receipt. A generic Node process or open port does not count. Discovery is read-only and loopback-only: it does not expose the T3 server, pair FrontierStack, or grant access to T3 threads and approvals. A T3 mark appears on that server in the macOS and iOS fleet lists. Live T3 job counts require a separately authorized read-only connector and are not inferred from worker presence.
Every Agent Operations worker row has a shell button. FrontierStack opens a login zsh locally, or the server's configured SSH/mosh/SSH3 command remotely, inside the same SwiftTerm PTY used elsewhere in the app. Terminal Style imports iTerm2 (.itermcolors), Ghostty, Alacritty or Warp themes.
The adjacent Terminal Sessions button discovers durable tmux, GNU screen, and Zellij sessions on that host. It uses a bounded, read-only inventory and never reads the terminal screen, scrollback, command history, process environment, or commands. You can attach in FrontierStack's real PTY, or end one named session after confirmation. Session names and managers are strictly validated and an end is reported successful only after the host confirms that the session disappeared.
On iPhone and iPad, More ▸ Agent Activity provides the paired Mac's status-only view of running agent processes, FrontierStack sessions and jobs, configured runtimes, and detected worker boxes. It deliberately omits prompts, command lines, transcripts, environment variables, terminal contents, and credentials. Servers ▸ Host ▸ Terminal Sessions lists the same durable sessions. Listing and ending use the paired Mac; full-screen attachment is offered only when Direct SSH has installed this phone's key and verified the server identity.
15.4Running local models
You do not have to send anything to a cloud model at all. FrontierStack manages local inference servers and can point the Administrator at one of them. The big three local apps are first-class:
- Ollama — the simplest local model runner; pull and serve models, and select one as the Administrator's engine.
- LM Studio — the LM Studio pane detects the install, lists loaded models and what is downloaded via the
lmsCLI, and shows "N models loaded" or "no model loaded" in its header. - LocalAI — a self-hosted, OpenAI-compatible server you run as a catalog service on port 8080.
Beyond these, the AI / LLMs category carries the whole self-hosted-inference shelf — vLLM, llama.cpp, Apple's MLX-LM server, Jan, LiteLLM (a proxy fronting 100+ providers), Open WebUI, AnythingLLM, PrivateGPT and RAG/vector tooling. The point of running one locally is privacy and cost: when the Administrator's engine is a local model (Ollama, a loopback endpoint, or Apple's on-device model), nothing is redacted because nothing leaves your Mac — the secret-scrubbing that protects cloud engines simply is not needed.
15.5Code sandboxes & browser automation
Agents need somewhere safe to run code and a way to read the live web. FrontierStack manages both.
For code, the E2B pane manages secure cloud sandboxes via the e2b CLI: enter an API key (stored in the Keychain as E2B_API_KEY, or authenticate once with e2b auth login), then list, spawn from a template, and kill running sandboxes — with a Kill All for housekeeping and an "include paused" toggle. A green dot marks running sandboxes; orange marks paused. It is the disposable, isolated machine an agent uses so its code never touches your servers.
For the web, the AI category includes browser and crawl tooling: Browserbase (managed headless browsers), Crawl4AI, Firecrawl and Apify for turning sites into clean, model-ready text, plus Playwright for scripted automation. These give an agent eyes on pages that have no API.
15.6GPU infrastructure & clusters
If your AI runs on real GPUs, the GPU Fabric pane gives you read-only health of the hardware. Pick a linked server and run diagnostics over SSH: GPU inventory and temperature (nvidia-smi), NVLink status, the GPU topology matrix, NVSwitch Fabric Manager health, DCGM inventory (dcgmi), InfiniBand and RoCE/RDMA links, Slurm GPU allocation, and composable-fabric CLIs (WEKA, Liqid, GigaIO). The GPUs live on Linux hosts, so this targets a server in your fleet; on a non-GPU machine the tools simply report "not found". Run one check or Run All Checks at once.
GPU thermals and load on a host are also surfaced through the standard host monitors (Chapter 8) when an agent is installed, so a GPU box that overheats raises an alert like any other machine. For scale-out, the AI Clusters category carries Exo (run one model across several of your Macs), Petals, Distributed Llama, Ray, Slurm and Run:ai; the ML Workbench category carries the experiment-tracking and pipeline tools (MLflow, ClearML, Weights & Biases, Kubeflow, JupyterLab) for the training side of the house.
15.7AI governance & safety
Running agents in production means watching what they do and bounding what they can. FrontierStack catalogs the AI Governance & Safety shelf so these tools sit alongside the runtimes they observe: Langfuse, Helicone and Arize Phoenix for LLM observability and tracing; Promptfoo, Ragas and garak for evals and red-teaming; Guardrails AI, NeMo Guardrails and Lakera Guard for input/output validation and prompt-injection defence; and governance platforms such as Credo AI and Holistic AI. Install and monitor them as catalog services; they are the audit trail and seatbelts for the agents on the boards above.
15.8The AI cost monitor
Running an assistant, your own agents, several local models and outside harnesses means spend in several places. AI Model Costs pulls it into one view. The header shows this month's total and the percentage of budget; a colour-coded bar turns orange at 80% and red at 100%. The AI tool get_ai_costs exposes the same figures to the Administrator.
The dashboard tracks three streams together:
- Metered API spend, per provider and model, computed from an editable price table (USD per million tokens), or entered directly from an invoice. Connect Accounts auto-pulls month-to-date spend from OpenAI, Anthropic, OpenRouter, DeepSeek and a self-hosted LiteLLM proxy — several accounts per provider, each its own cost line.
- Every recurring charge you have, not just AI. Presets cover the common AI plans, cloud and hosting (Cloudflare, Vercel, DigitalOcean, Hetzner, Backblaze…), SaaS tools (Apple One, Google Workspace, 1Password, Figma, Adobe…) and yearly costs like domain renewals, Apple Developer and TLS certificates — and you can type any name at all, so a service with no API is tracked exactly like one the app can query. Each entry is billed weekly, monthly or annual; the row shows what you actually pay while the totals normalise to a monthly figure. Entries group by category with their own subtotals, the header carries both monthly and annual totals, and toggling a row off excludes it from the totals without deleting it — useful when you are working out what to cancel. Your FrontierStack licence is added automatically, priced from your tier.
- Local CLI usage — a one-click scan of this Mac's Claude Code and Codex logs sums the month's tokens per model as an estimate.
Costs arrive in whatever currency each service bills — a US SaaS in dollars, a European registrar in euros, the FrontierStack licence in yen. Every entry keeps its native amount and currency, and the totals convert everything to your chosen display currency. Exchange rates are editable and dated, refresh on demand from the ECB daily fixing, and re-price history instantly when changed — budgeting estimates, not accounting entries. Most service panes also carry a Plan & Cost section, so you can record what you pay right where you manage the service and it lands in these totals immediately.
Any subscription can carry a renewal date. Once it has one it appears under Upcoming Renewals and raises an Alert when it enters the reminder window — seven days by default, adjustable per row — on the same path as domain and TLS expiry. An auto-renewing row rolls its date forward on its own, catching up even if the Mac was off for months; a manual one stays put and reads as overdue, because nothing charged you. Mark a row a free trial and it counts nothing toward the totals until the day it converts, then warns you before it bills. Mark one cancelled from a date and it keeps counting until that date and then stops, so the saving lands when it really lands; naming what replaced it nets the replacement off, so a $20 plan swapped for a $15 one reads as $5 saved rather than $20. Changing a price through the renewal editor records the old one, so a plan that has crept up is visible as having crept.
If you already track subscriptions in Wallos, the open-source self-hosted tracker, you do not have to type them twice. Add Wallos from the catalog, point the pane at your instance with an API key from its profile page, and Import into Spend & Billing copies its subscriptions in — price, currency, billing cycle, next payment and cancellation date — where they join everything else in one total and earn the same renewal alerts. Re-importing updates the rows it created rather than duplicating them, so it is safe to run whenever Wallos changes. FrontierStack only reads from Wallos; it never writes back, so a mistake here cannot touch your data there.
A by-provider breakdown (donut chart), a six-month trend with the budget line, and an Ask AI button that hands your spend to a cost-optimisation advisor round it out. A billing-health watcher probes connected paid services for out-of-credits, hard-limit, past-due or suspended states and raises an alert — catching a key that is about to stop working before it does. Spend-threshold alerts complete the picture: crossing 80% or 100% of the monthly budget raises an alert (recovery included), each synced AI account can carry its own monthly limit, and DigitalOcean, Vultr and Linode panes read this month's charges from the provider API with a threshold of their own.
Part V
Tailoring FrontierStack to a vertical, then the practical book-end: settings, licensing, updates, shortcuts and troubleshooting.
Chapter 16
Business & Vertical Solutions
FrontierStack already speaks the language of more than a thousand services. A preset reveals the handful that matter to your business — and a few panes turn them into a working back office.
The catalog in Chapter 6 is deliberately enormous. No single business runs a graph database, a render farm and a hotel channel manager at once — so the point of this chapter is not breadth but focus. FrontierStack ships with presets and saved Setups that hide everything irrelevant and surface the dozen or so services a particular line of work actually needs. This chapter walks the verticals the app is tuned for and shows which services each one reveals.
Think of it as a lens, not a new product. The web stack, monitoring, scripts and the AI Administrator you met earlier do not change; a preset simply decides what you see first.
16.1Presets, Setups and the vertical lens
Two mechanisms tailor the app. Presets are built-in starting points: choose Presets ▸ Drop-shipping or Presets ▸ Small Business and the sidebar reshapes to that trade — the right service categories appear, an opinionated set of monitor panes float, and the noise of the other 900 services recedes. Setups are your own saved snapshots of that view (which services are shown, which are pinned, the floating-palette layout, and an optional network location to bind it to). You build them in the Setups pane and flip between them from the Presets menu, exactly as covered in Chapter 3.
The workflow is the same for every business below: apply the preset, set up the two or three services you actually use (paste an API key, enable a channel), and save the result as a Setup so you can snap back to it after a detour into "show everything".
16.2The Small Business preset
This is the classic macOS Server use case, modernised: a single Mac mini running the back office for a shop, studio or practice. The Small Business preset reveals the categories a storefront depends on, every one of them self-hostable on the Mac in front of you, with the backups, monitoring and hardening from Parts II–III underneath.
| Need | Services revealed |
|---|---|
| Point of sale | Square (built-in pane), Toast, Lightspeed, Floranext |
| CRM & loyalty | SuiteCRM, EspoCRM, Odoo CRM (self-hosted); HubSpot, Zoho, Pipedrive; Square Loyalty, VoucherVault |
| E-commerce & CMS | WooCommerce, Medusa, Saleor; WordPress, Drupal, Ghost; Stripe / PayPal / Square checkout |
| Mailing lists | Listmonk, Mautic (self-hosted); Mailchimp, Brevo, SendGrid |
| Mail server | The built-in Mail Server pane, mailcow, Modoboa, with SPF/DKIM/DMARC tooling |
| Calendars | Radicale, Baïkal, SOGo (CalDAV/CardDAV); the Calendar Health pane |
| Accounting | ERPNext, Xero, QuickBooks, freee, Money Forward |
| Helpdesk | Zammad, osTicket (self-hosted); Freshdesk (live ticket counts) |
Several of these are more than catalog entries. The CRM, helpdesk, store and mailing-list services with simple, key-based APIs surface live metrics in their pane — Freshdesk shows open/pending/overdue tickets, Shopify shows open orders, Mailchimp shows subscriber totals — and you can switch on "Alert me" with a threshold so a backlog reaches you on your usual channels (Chapter 11).
16.3Hospitality & short-term rentals
For vacation rentals and small hotels, FrontierStack includes a built-in Channel Manager pane (category PMS) that turns your property-management platform into a live dashboard. It is the engine room of the hospitality preset.
Open Channel Manager and, under PMS Health, enable the one platform you run and paste its credentials — the field labels adapt per platform: an Account ID for Hostaway, an API key for Lodgify, a client ID + secret for Guesty, a Bearer token for Cloudbeds, an API token for Beds24, or an Application Access Key for a custom AppSheet app you built yourself. Check confirms the API endpoint is reachable; Sync pulls live reservations, and the Reservations (Platform API) section lists guests, channels, dates and totals, with revenue and an occupancy dial at the top.
Not every OTA needs a platform API. The Calendar Sync section ingests each channel's iCal export — point a channel at its iCal URL, or Import from ICS Feeds to pull in the Airbnb, Booking.com, Vrbo and Expedia feeds you added in the ICS Feeds pane — merges them into one calendar with no API key at all, and lets you Save or Copy the combined .ics to share to Apple, Google or Outlook.
Turnovers close the loop. The Cleaning & Turnovers — Turno section either connects Turno's API directly or, more simply, lets you Copy reservation iCal for Turno — add that calendar inside Turno and it auto-books a clean from every check-out.
Quiet hours can be watched too. Connect Minut noise and occupancy sensors in the Minut pane and FrontierStack alerts when a noise disturbance is in progress, when a sensor goes offline, or when its battery runs low. These alerts go through Alerts, so a contacts preset can reach the property manager on duty. Minut has to grant API access to your account first (it ties this to its Enterprise plan).
16.4Drop-shipping & e-commerce fulfilment
The Drop-shipping preset reveals five purpose-built categories — Sourcing & Suppliers, Print-on-Demand, Shipping & Fulfillment, Inventory Sync and Profit Analytics — alongside your e-commerce platform and SEO tools, and floats the Drop-shipping Health monitor.
| Stage | Services revealed |
|---|---|
| Sourcing & suppliers | AliExpress, Alibaba, CJdropshipping, Spocket, Zendrop, SaleHoo, DSers |
| Print-on-demand | Printful, Printify, Gelato, Gooten |
| Shipping & fulfilment | AfterShip, ShipStation, Easyship, Shippo, Pirate Ship |
| Inventory sync | SkuVault, Cin7, Zoho Inventory, Katana, zaiko Robot |
| Profit analytics | Triple Whale, Lifetimely, BeProfit |
The live piece is delivery tracking. Drop-shipping Health reads AfterShip's tracking API directly (store your key once) and tallies shipments by state — in-transit, delivered, pending, and a problem list of the ones stuck or exception-flagged — so a stalled package surfaces before the customer emails. The inventory, marketplace and profit sections are framed placeholders that light up as you connect their catalog services; AfterShip is wired live today, with the others reachable through their own panes.
16.5Education
Schools and campuses live across a different set of categories. There is no single "education preset" button, but the catalog groups the pieces cleanly, and a Setup pins exactly the ones your institution uses.
| Function | Services revealed |
|---|---|
| Student information | PowerSchool, Infinite Campus, Veracross; openSIS, RosarioSIS (self-hosted) |
| Learning management | Canvas, Schoology, Google Classroom; Moodle, Open edX, ILIAS, BigBlueButton |
| Digital library | Koha, DSpace, Greenstone (self-hosted); EBSCOhost, JSTOR, ProQuest |
| Campus & school ops | Slate & OpenApply admissions, FACTS tuition, StarRez housing, FET timetabling, ParentSquare |
The open-source members of each row — Moodle, Koha, openSIS — are full self-hosted web apps you can run on the stack from Chapter 4, monitored and backed up like any other site. The cloud members are reached through their credential panes for at-a-glance status.
16.6Business messaging & customer comms
Reaching customers where they already are is its own category. Business Messaging collects the store-to-customer channels that matter region by region: WhatsApp Business, LINE Official Account, WeChat and Zalo official accounts, KakaoTalk Channel and AlimTalk, Messenger, Instagram DMs, plus inbox and bot tools such as Intercom, ManyChat, Respond.io, WATI and Gorgias.
Three of these carry a live reachability check today — WhatsApp Business surfaces its verified name and quality rating, Intercom and ManyChat confirm the token works — while the rest capture credentials and a deep link to their console. The AI Administrator can see this picture too: its get_messaging_channels tool reports which channels are connected and which alert gateways can actually send, so you can ask it to confirm where a broadcast could go.
16.7Calendars, Accounts & Apple services
A Mac-based business is also an Apple business. Several built-in panes manage the parts of Apple's ecosystem that touch your servers.
- Calendars. Calendar Discovery scans common CalDAV ports (Radicale 5232, Apple 8008/8443, SOGo 20000, 80/443) and the
/.well-known/caldavpath; add an endpoint to Calendar Health to keep it watched. This is the path to keep an old macOS Server CalDAV alive, or to stand up Radicale or Baïkal fresh. - Accounts. The Accounts pane reads Open Directory and LDAP, and can migrate exported entries into a target directory via
ldapadd— the bridge for moving users off legacy Apple directory servers. - Apple services. The Apple Services pane reports the signed-in Apple Account, which iCloud+ services are enabled, and Find My Mac status — a quick audit of what this machine is tied to.
- Apple Home. Because HomeKit's database is private to system apps, the Apple Home pane drives it through the Shortcuts bridge: any scene or automation you wrap in a Shortcut with a Home action becomes runnable from FrontierStack, useful for tying premises automation to your ops.
16.8Accounting, healthcare, AV & print
A few more verticals round out the catalog, each surfaced as a category you pin into a Setup:
- Accounting & ERP. ERPNext self-hosted; Xero, QuickBooks, freee, Money Forward, Plaid and Expensify by API — the books beside the storefront.
- Healthcare. Open-source clinical systems for practices that self-host: OpenEMR, OpenMRS, GNU Health, LibreHealth, the Orthanc DICOM/PACS server, and Japan's OpenDolphin and ORCA. Treat these with the security discipline of Chapter 10; patient data raises the stakes.
- AV & Stage. For venues and production: the AV Feeds pane plus Dante audio-over-IP, Q-SYS, QLC+ and grandMA lighting, OBS, NDI, Resolume, digital signage and Chromecast control — the show and the network behind it in one window.
- Print Production. A built-in pane for print and pre-press shops, sitting in the Fleet & Remote group alongside the render farm.
None of these is a deep how-to here — the per-service detail lives in Chapter 6. The job of this chapter is to show that whatever your business is, FrontierStack already knows the services it runs on, and a preset or Setup is all it takes to reveal exactly those and nothing more.
Chapter 17
Settings, Licensing & Updates
One Settings pane holds every preference; an Ed25519 licence unlocks your tier offline; Sparkle keeps the app current; and a single switch turns telemetry off.
Almost everything you can configure about FrontierStack itself — as opposed to the services it manages — lives in one place: the Settings pane. This chapter is the reference for that pane and for the three systems that surround it: how the app is licensed, how it updates itself, and what it does and does not send back about how you use it. Several of these controls also shape the AI Administrator, so it cross-references Chapter 13; for anything that goes wrong, see Chapter 18.
17.1The Settings pane
Open it from the sidebar, or from the app menu with ⌘, — the standard macOS Settings window is just a signpost with a Full Settings button that opens the same pane, because FrontierStack keeps every preference together rather than splitting them between two windows. The pane is a single scrolling form of grouped sections: General, License & Subscription, Updates, Privacy & Diagnostics, Locations, Text Editor, Images, Menus, Capabilities, and the cloud/backup destinations.
The General section holds the preferences you set once and forget. Pick a Default Browser (Safari, Chrome, Firefox, Edge, Brave or Arc, if installed) and every "Open in Browser" action across the app uses it. Show in Menu Bar adds a global menu-bar item for starting and stopping your service group. Appearance forces Light or Dark regardless of the system setting, and Theme (accent) tints the whole UI — pair Amber or Terminal Green with Dark for a classic terminal look. Launch at login and a keyboard-navigation focus ring round it out.
Two General toggles deserve attention because the AI can also set them (below). Run commands in the in-app console is on by default: installs and shell commands stream live in a FrontierStack window and panes auto-refresh when a command finishes. Turn it off to send those commands to Terminal.app instead. Interactive sessions — SSH, REPLs — always open in a real terminal. The companion External Terminal picker (under Text Editor) chooses which terminal app the "Open in Terminal" actions use: Terminal and iTerm run the command inline, while other apps open an executable .command.
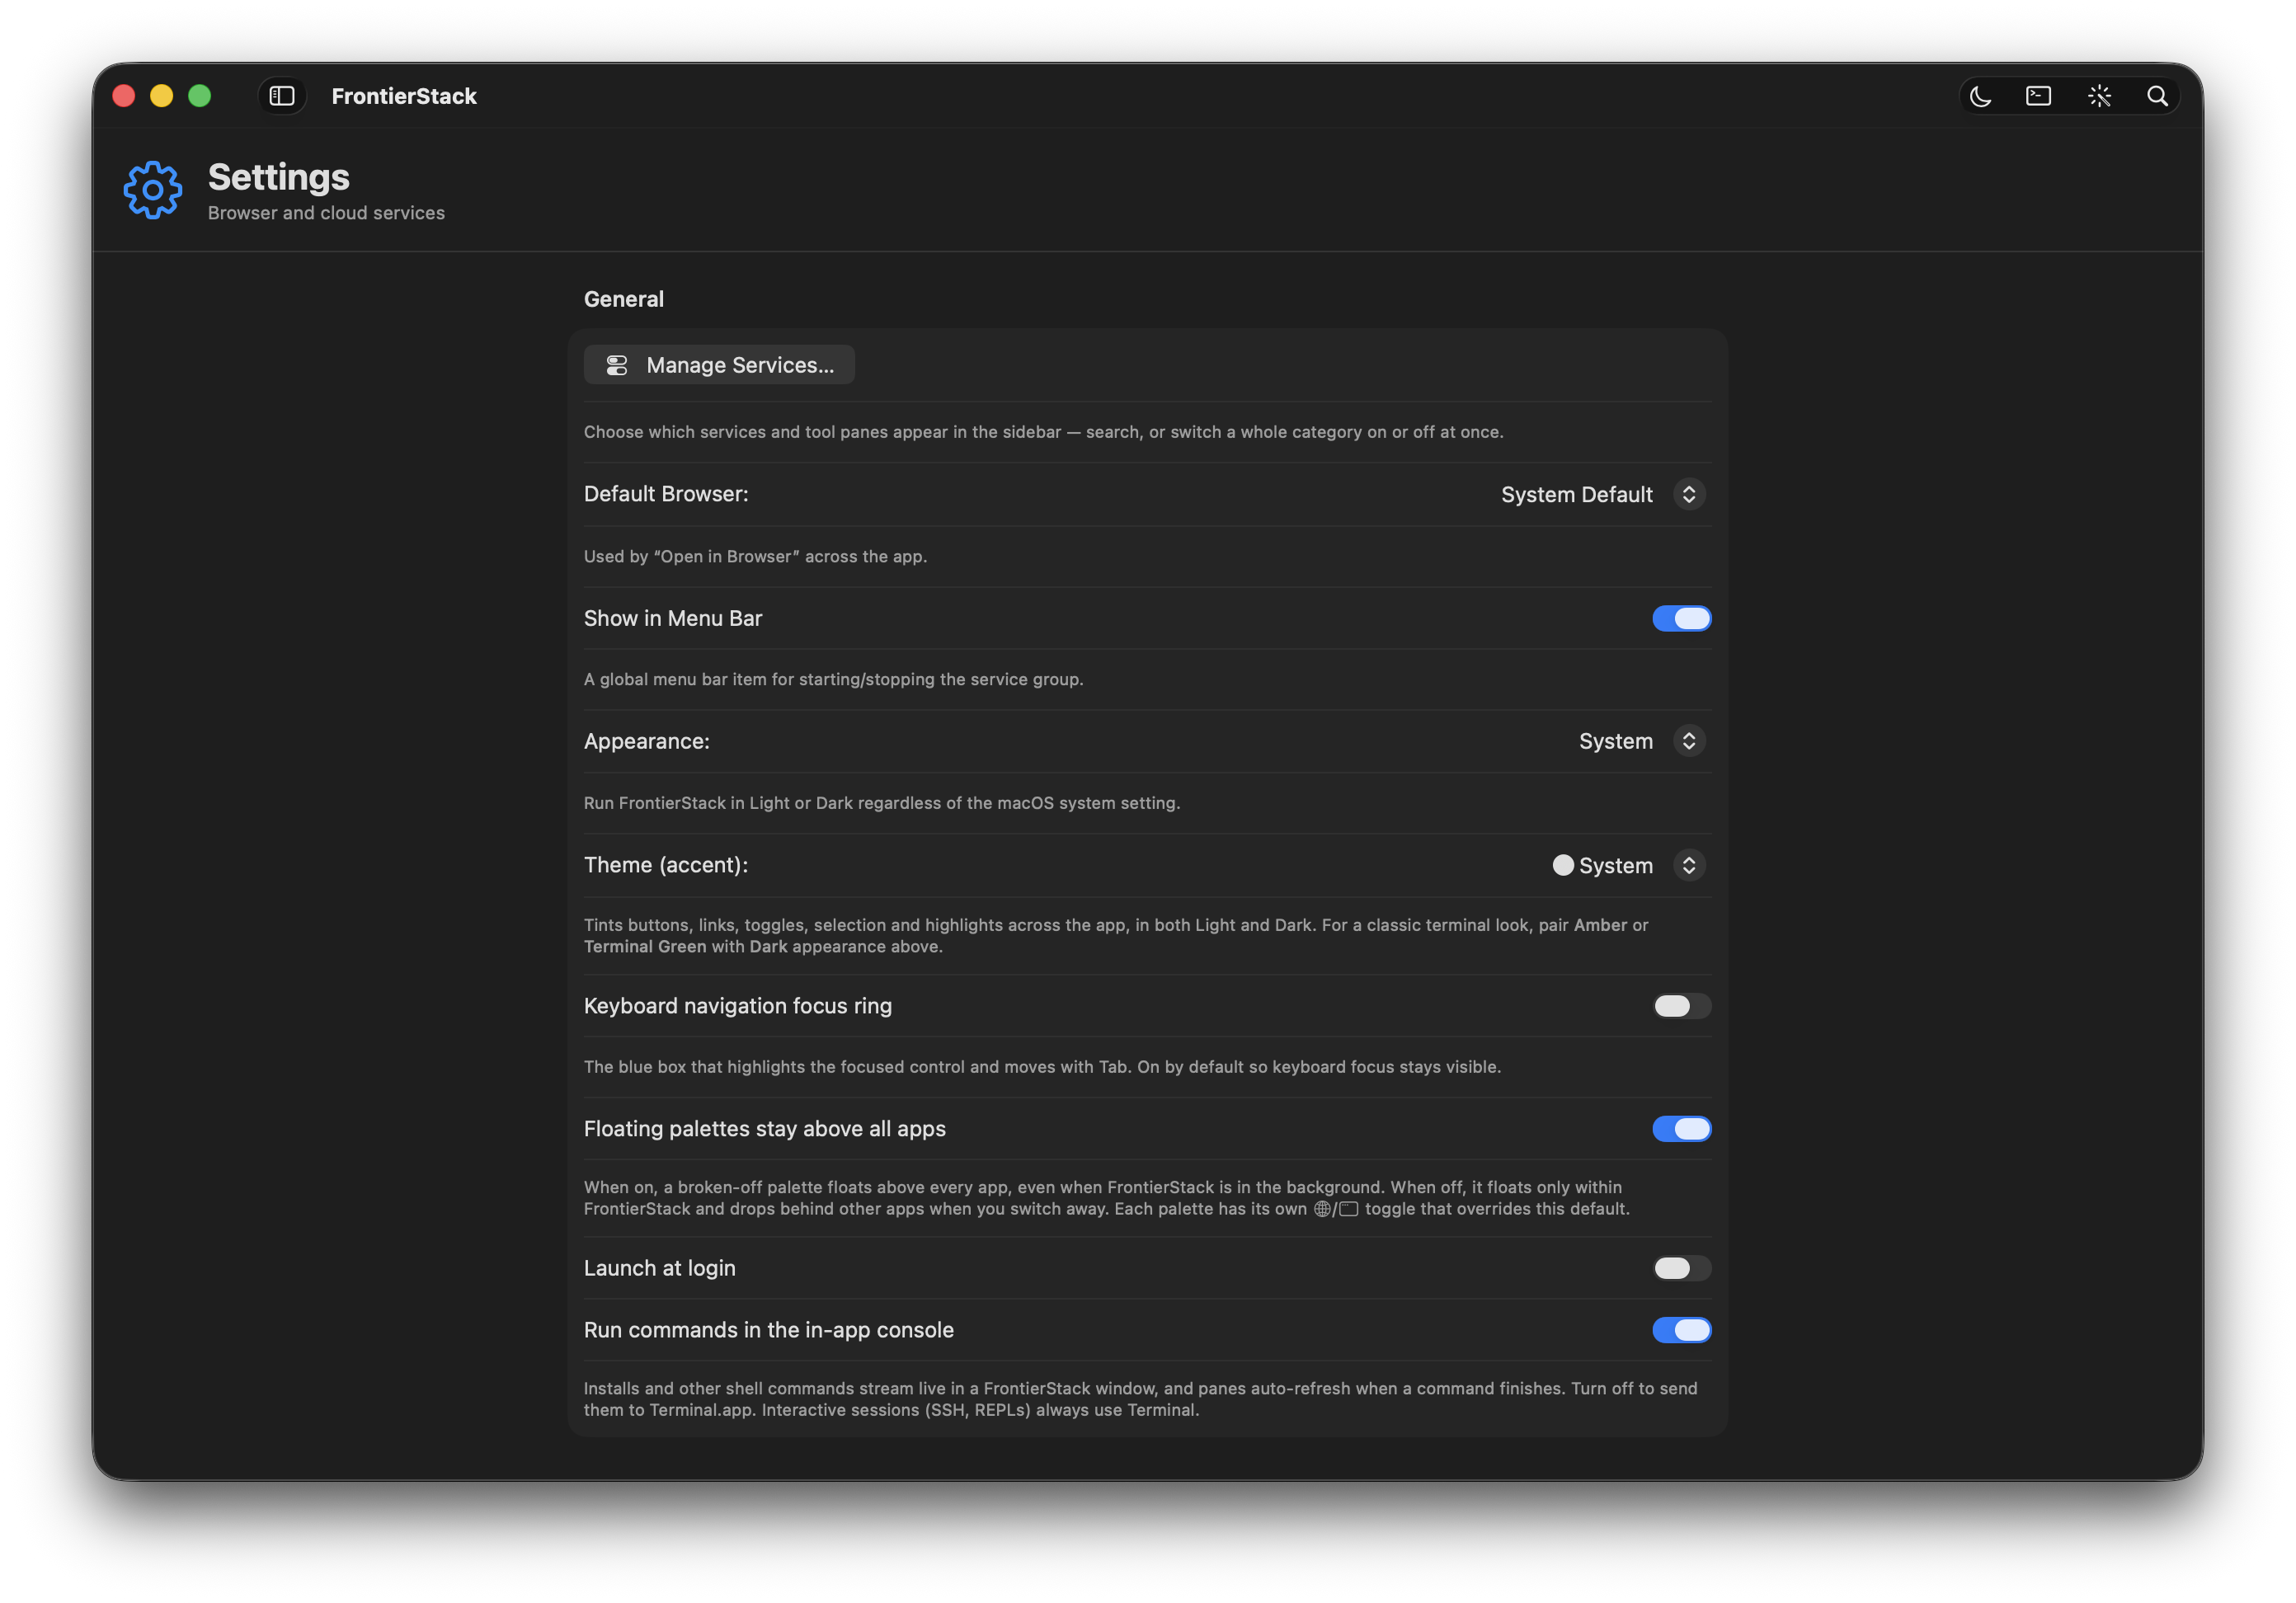
17.2App-setting keys the AI can change
A handful of these preferences are exposed to the AI Administrator through the get_app_settings and set_app_setting tools, so you can simply ask: "switch my default browser to Firefox", or "stop showing the Presets menu". The assistant reads and writes only the keys in the table below — nothing else about Settings is reachable from a prompt.
| Key | Type | What it controls |
|---|---|---|
defaultBrowserBundleID | bundle id | The browser used by every "Open in Browser" action. Empty = system default. |
showInMenuBar | bool | Whether the global menu-bar item appears. |
preferInAppConsole | bool | Run commands in the in-app console (on) or send them to Terminal.app (off). |
menu.showPresets | bool | Show the Presets menu in the menu bar. |
menu.showLocations | bool | Show the Locations menu in the menu bar. |
The last two also live under the Menus section of the pane, alongside the App Settings… (⌘,) button. Hide a menu you never use; show it again the moment you do.
17.3Accounts and advanced settings
Two panes sit just outside Settings but are worth naming here. The Accounts pane (sidebar ▸ Accounts) is not about billing — it connects FrontierStack to a directory service (Active Directory, Microsoft Entra ID, Okta, OpenLDAP, FreeIPA, 389 Directory Server, Jamf or a local/remote Open Directory), tests the binding, and imports user accounts. It also includes an Open Directory editor for managing OD users and groups on a Mac that runs one. Directory work is covered with the rest of identity in Chapter 10.
"Advanced settings" in FrontierStack means the per-site Advanced Settings sheet for a website — the full Apache <Directory> and <VirtualHost> editor (Options flags, AllowOverride, Require rules, ServerAdmin, custom ErrorDocument). You reach it from a site in the Sites pane; anything the form doesn't model is editable through Edit as Text…. It is documented with the web stack in Chapter 7.
17.4Custom Instructions for the AI
The single most powerful "setting" for the AI is not in the Settings pane at all: it is the Custom instructions bar at the bottom of the AI Administrator pane. The text you write there (stored as frontierstack.md) is appended to every AI request — the assistant chat, one-shot Ask AI, skills, and the MCP server — so it is the right place to state persistent preferences once: your preferred language and tone, things the assistant should always or never do, and facts about your setup it should assume.
Click Custom instructions to expand the editor, toggle Add my instructions to every AI prompt, and type. Examples that work well: "Always reply in Japanese", "Prefer Homebrew over Docker", "Never restart MySQL during business hours (09:00–18:00)", "My production fleet host is web1.example.com". Save with the Save button, or open the file in your external editor. Because this file flows through the whole harness chain, it complements — but does not replace — the trust model in Chapter 13: instructions steer the AI's behaviour, while the read-only default and per-action approvals govern what it is allowed to do.
DB_PASSWORD); the value is injected as an environment variable at run time and never sent to a cloud model. Reference secrets in scripts as $NAME. See Chapter 13.17.5Command-Line PATH and Homebrew
Two reference panes from Chapter 2 belong to the same family of app-level controls. The Command-Line PATH pane (sidebar ▸ Command-Line PATH) shows the directories a login shell searches for commands and lets you add your own to a managed block in ~/.zprofile (or the profile you choose); entries you add are prepended to PATH and take effect in a new terminal. The app already deep-resolves tools through the shell, so this is mainly to make commands such as mlx_lm.server resolve instantly. The Homebrew pane installs and updates Homebrew itself and the formulae behind many services. Both are covered in full when you first set up the app; this chapter simply notes that they live alongside Settings as the place to manage the command environment.
17.6Licensing
FrontierStack is a free download with paid tiers, sold and billed through Square — card data is vaulted by Square, never seen by FrontierStack. After purchase you receive a licence code in the form FSK-XXXX-XXXX-XXXX. Open Settings ▸ License & Subscription ▸ Activate License…, paste the code, and this Mac is bound to your plan. Promo codes are applied at checkout on the website.
| Tier | Price | Servers | Notes |
|---|---|---|---|
| Free mode | Not a checkout plan | 1 | The built-in fallback without a paid entitlement; limited features. |
| Standard | ¥15,000/year or ¥45,000 one-time | 10 | Runs on 3 Macs. A 10-pack add-on widens every limit. The one-time purchase receives Lifetime status. |
| Standard — Bleeding edge | ¥7,500/year | 10 | Campaign subscription with no price rise after year one while it remains active. |
| Full Fleet | ¥45,000/year | Unlimited | Everything, plus the Wild Frontier update channel. No one-time or Lifetime option. |
A Standard licence runs on 3 Macs and covers a defined estate: 10 servers, 5 routers, 5 printers, 10 switches, 10 Wi-Fi access points, 10 locations, 10 KVMs, 10 UPS units, 20 IoT devices and cameras, 20 domains or DNS zones, 25 containers and VMs on servers, and 5 paired iPhones or iPads. Adding a 10-pack increases every one of those by another full allotment and adds one more Mac — so two packs means three times the base and 5 Macs. Full Fleet is unlimited throughout. The complete comparison lives at frontierstack.app/compare.
The section shows your tier, a status pill (Active, Lifetime, Past due, Canceled), the renewal date, your licence code and this Mac's server cap. Manage / Renew… and Buy / Upgrade… open the website; the ⋯ menu offers Check status now, Deactivate this Mac and Sign out. Activated Macs lists every Mac using the licence with the date it was activated, and lets you release one to free its slot — deactivating this Mac is immediate, while releasing a different Mac emails the licence owner a confirmation link, so knowing the code is never enough to remove someone else. You can also self-transfer a limited number of times per year; a Mac that loses its seat quietly drops to Free on its next check-in. The same self-serve status and seat list are available on the My Licence web page at frontierstack.app/license. The identical controls also live in a dedicated Licences pane in the Overview group of the sidebar.
17.8.1What needs Full Fleet
Standard is a complete product, not a trial: the entire local stack, local sites, DNS and certificates, migration from macOS Server and MAMP, local health and alerts, device discovery, Homebrew and local Docker, database cluster health, remote KVM and power control, the advanced remote agent, the audit and change log, AI diagnosis with proposed fixes, and remote diagnostics one server at a time — all included.
Full Fleet is about doing things to many machines at once, and about letting other systems drive FrontierStack: Fleet Run across every server, Fleet Push and Promote to Production, Service Guardian on remote hosts, AI auto-remediation and scheduled AI reports, fleet-wide security audits, EDR rollups, Kubernetes fleet actions, the production print fleet, router and firewall fleet dashboards, SNMP at scale and PoE cycling, SaaS and business monitoring, cloud inventory and cost rollups, external AI control over MCP, Fleet Skill, iPhone remote control, team and admin controls, alert routing and escalation, container fleet monitoring, GPU workloads, and production deploy workflows.
machine_id = SHA-256(IOPlatformUUID + bundle id), so copying the app to another Mac does not copy the licence. The app trusts the token until it expires plus a grace period, then refreshes; if a paid plan lapses it degrades to Free mode. Lifetime applies only to a one-time Standard purchase and never lapses; Full Fleet has no Lifetime option. This is a deterrent, not heavy DRM — reads keep working; only the limits and premium features are gated.17.7Updates
FrontierStack updates itself with Sparkle, driven by the in-app UpdateManager. The Updates section of Settings is the whole control surface. Automatically check for updates and Download updates in the background are on by default: a new build downloads silently and then offers an Update button that installs it and relaunches the app. Press Check Now any time; the current version is shown beside it.
The Check for updates menu sets how often the background check runs. Automatic (the default) checks daily — more often on Wild Frontier — while Once a day, Every 3 days, Once a week and Every 2 weeks pin a fixed interval, so if daily prompts feel noisy you can drop back to, say, a weekly check. It has no effect while automatic checking is off, and Check Now always works regardless of the interval.
There are two channels. Stable is the default and ships only when there is enough to justify an update. Wild Frontier delivers frequent, roughly every-other-day bug-fix builds — turn it on if you have requested a change and want the fix fast. To switch, choose it from the Update channel picker. Wild Frontier early builds require a Full Fleet plan; every other plan always receives Stable updates, and the pane tells you so if your tier can't opt in.
17.8Telemetry & privacy
FrontierStack collects a deliberately small amount of anonymous usage data, and you can switch all of it off. The Privacy & Diagnostics section has two toggles, both on by default. Share anonymous usage analytics sends a small daily ping to frontierstack.app; Send crash reports adds a technical backtrace, and only after you approve the prompt that appears when the app has crashed.
The analytics ping contains a random install ID (no account, no login), the app and macOS version, your hardware model and locale region, your update channel, and whether you used any AI feature. Your country is derived server-side from your IP by Cloudflare. No documents, file contents, configuration, keys, passwords or personal data are ever sent. Crash reports add only a kind, message and stack trace, written locally first so you can decline before anything leaves the Mac.
Two more sections round out the pane: Capabilities exports CAPABILITIES.md and capabilities.json — a complete, live description of every service and AI tool — for handing to an external AI engine; and the Cloud Services, Backups (Local Git), Amazon S3 and Cloud Sync (rclone) sections configure where settings backups and site files are stored. With Settings, licensing, updates and privacy understood, turn to Chapter 18 for keyboard shortcuts, the URL scheme and troubleshooting.
Chapter 18
Keyboard, URL Scheme & Troubleshooting
The fast paths and the safety nets: shortcuts, deep links, the app's own logs, and a calm answer for the handful of things that go wrong.
This closing chapter is the reference you reach for when you already know what FrontierStack does and just want to do it faster — or when something is red and you want the shortest route to green. It collects the keyboard shortcuts, the frontierstack:// URL scheme, where the app keeps its own logs, and a symptom-to-fix table for the problems that actually come up. None of it is essential reading; all of it saves you time.
18.1Keyboard shortcuts
FrontierStack is a native Mac app, so the system shortcuts you already know — ⌘W to close a window, ⌘, for Settings, ⌘Q to quit — all work. On top of those, the app adds a small, deliberate set of its own. The philosophy is restraint: most actions live on clearly labelled buttons, and almost every dialog follows the Mac convention that Return confirms and Esc cancels, so you rarely need to memorise anything.
| Shortcut | Does | Menu equivalent |
|---|---|---|
| ⌘F | Open the Search palette — find any service, tool, pane or action by name and jump straight to it. | Toolbar magnifying-glass button |
| ⌘? | Open the in-app Help window. | Help ▸ FrontierStack Help |
| ⌘⌥⇧W | Close all floating palettes at once. | Palettes ▸ Close All Palettes |
| Return | Confirm the default button in any sheet (Save, OK, Add, Install…). | The highlighted button |
| Esc | Cancel or dismiss the current sheet or palette. | Cancel / Done button |
The menu bar carries the rest of the app's reach: dedicated Services, Locations, Monitors, Presets and Palettes menus let you switch a service, change location, toggle a monitor, apply a saved preset or pop out a floating palette without leaving the keyboard. Because these are real menu commands, macOS lets you assign your own shortcut to any of them under System Settings ▸ Keyboard ▸ Keyboard Shortcuts ▸ App Shortcuts — add FrontierStack, type the menu item's exact name, and pick a key.
When several windows or palettes hide one another, choose Palettes › Organize Windows & Palettes. FrontierStack tiles the visible, resizable windows on each connected display independently, using the area outside its menu bar and Dock. Full windows get the main area, floating palettes use a side rail where space permits, and mini palettes remain compact. Windows stay on their current display; confirmation, approval and other temporary panels are not moved. The resulting palette frames are saved with the active Setup like any manual layout.
18.2The frontierstack:// URL scheme
FrontierStack registers the frontierstack:// URL scheme, which deep-links straight to any pane, server or service. Opening such a URL brings the app to the front and navigates — expanding the right sidebar group and scrolling to the destination. This is how a link in a note, a Shortcuts action, or a line in a script can send you (or a teammate) to exactly the right screen.
From Terminal you trigger one with open; from Shortcuts use the Open URLs action; in a note or web page it is an ordinary link. The forms are:
| URL | Goes to |
|---|---|
frontierstack://server/<name-or-id> | That fleet host's pane (falls back to Local Health if unknown). |
frontierstack://website/<domain> | The Sites pane. |
frontierstack://container/<name> | The Docker pane. |
frontierstack://pane/<Name> | Any pane by its display name, e.g. pane/Security, pane/Apache, pane/Alerts. Spaces are URL-encoded (%20). |
frontierstack://service/<catalog id> | A catalog service by its id. |
frontierstack://kube/<context> | A Kubernetes context (or the Clusters pane with no argument). |
frontierstack://security · ://alerts · ://health | Shortcuts to the Security, Alerts and Local Health panes. |
frontierstack://device/<id> · ://wifi/<ssid> · ://zone/<id> | A discovered device, a Wi-Fi network, a Cloudflare zone. |
frontierstack://open?sel=<raw> | The exact escape hatch: an internal selection value that round-trips precisely. |
A few worked examples:
open "frontierstack://pane/Security"
open "frontierstack://server/mac-mini-office"
open "frontierstack://website/example.com"
Deep links are the connective tissue of automation in FrontierStack. A preset can include a link that jumps to its dashboard; a runbook in Notes can link each step to the pane where you carry it out; an alert message can point at the failing service. The same scheme also names two read-only resources for AI — frontierstack://capabilities and frontierstack://health — that the MCP server exposes (see Chapter 14).
frontierstack:// URL brings the window forward so you can unlock, but it will not navigate — external automation cannot move the app around behind the lock screen.18.3Reading the app's own logs
The Logs pane reads any machine, not just this Mac: a Machine picker at the top switches to a linked server, whose logs are fetched over SSH — or through its FrontierStack monitor where one is installed, which runs as root and so reaches privileged logs without sudo. The source menu lists the services actually running on the chosen machine first (Apache, Nginx, MySQL, PHP-FPM, PostgreSQL, Redis, Ollama), then any other log files it finds, and finally crash reports and diagnostics — the .ips, .crash and .panic files Console shows, newest first, from both the user and system DiagnosticReports folders.
When you need to know what FrontierStack itself did — not what a service did, but the app — there are three places to look, in increasing depth.
- The Change Log (Audit). The Logs pane includes a Change Log that records every setting and configuration change with the responsible actor: User, the AI Harness, the Web control panel, MCP, or Automation. If a service goes down, this tells you exactly what touched it and who or what was responsible — the fastest first question in any incident.
- The in-app console. Installs and shell commands run in a real terminal window inside the app (a PTY, so password prompts and y/n questions work), streaming live output. Because the app knows when the command finishes, it refreshes the pane that launched it. You can export a console transcript from its actions bar. Theme it under Terminal Style in Overview.
- The log files. FrontierStack writes its own log to
~/Library/Logs/FrontierStack. Open that folder in Finder, or read it in Console.app, when you want the raw record — it is the most detailed account of what the app was doing. The Auto-export feature (Overview ▸ Settings) can copy these logs, your change-log and settings backups to a folder on a schedule.
read_log tool accepts a source of "frontierstack" to tail ~/Library/Logs/FrontierStack, "os" for the system log, or a service name like "nginx" or "postfix". On a linked server it reads over SSH, and output is capped and secret-redacted before any of it reaches a cloud model (Chapter 13).18.4Common problems & fixes
Most trouble in FrontierStack is one of a small, familiar set, and the app usually offers the fix as a button rather than a chore. The table below maps the symptom you see to the shortest route back to green.
| Symptom | Likely cause | Fix |
|---|---|---|
| A service won't start. | A port is already in use, the binary isn't installed, or the config is invalid. | Open the service's pane and read the status detail. Use Ports in Use to find a conflict; install or repair via Homebrew; for web servers, validate the config before reloading. The AI Administrator's repair_service can diagnose and fix common cases on your approval. |
| A linked server's status dot is red: "Permission denied (publickey)". | The server was reinstalled, its host key changed, or the app's SSH key was never installed. | Run Repair SSH access (the AI's repair_ssh_access tool, Chapter 8). It clears the stale host key and re-installs the app's managed key using a one-time login password stored as a vault secret — the password is read locally and never sent to the model. The dot turns green on success. |
| Alerts aren't arriving. | A channel is misconfigured: a wrong token, an unverified sender, a bad webhook. | Open Alerts. A per-send Delivery Errors section lists exactly which channel failed and why; fix the credential and Clear delivery errors. Send a test to confirm before relying on it (Chapter 11). |
| The AI refuses an action. | It is read-only by default, or a specific server toggle is off. | Enable Allow changes (and Allow scripts if it wants to run one) on the AI Administrator, or the relevant per-server toggle. The refusal message names the exact setting — see below. |
| Homebrew is missing. | The package manager many services rely on isn't installed. | Open the Homebrew pane (Overview). The app can install Homebrew for you and then offers one-click installs of formulae from each service's pane. |
| A certificate isn't trusted. | A self-signed or local certificate the system doesn't yet trust. | For local development, issue with mkcert, which installs a trusted local CA; for public sites use Let's Encrypt. Manage both in Certificates and the Sites ▸ TLS tab (Chapter 7, Chapter 10). |
| macOS says FrontierStack “contains software that is not compatible”. | The bundled El Capitan/Sierra monitor build, which macOS 26/27 flags for using a pre-10.14 load command. | Nothing. The warning is advisory and the app is unaffected — see the note below. |
LC_VERSION_MIN_MACOSX load command that recent macOS releases warn about. That file is a payload: it is never executed on your Mac, only copied to an old Intel server over SSH during Install & Enroll. Universal and Intel binaries are not the cause — every other executable in the app is arm64 or a current universal build, and the app contains no 32-bit code at all. Dismiss the warning; it costs you nothing.18.5MCP onboarding & the actionable refusal
The first time the app sees a chance to, it asks — once — whether you would like to start the MCP server so an outside AI tool can use FrontierStack. The prompt explains the model plainly: the server is localhost-only and read-only by default. Start MCP server turns it on; an optional toggle on the same sheet lets you allow changes there and then; Not now simply remembers that you were asked. The server stays off until you choose otherwise (Chapter 14).
In the MCP pane, Detected AI clients recognizes Amp, Grok, Codex CLI, Cursor, Gemini CLI, Claude Code, Claude Desktop and Xcode. Configure one client, use Set Up Detected, or enable setup at launch. FrontierStack preserves every unrelated MCP entry and installs only its own owner-only bridge; the bearer token remains in Keychain rather than the client’s configuration. Amp setup does not enable its remote thread or terminal features. Network-open MCP is a separate, explicit choice for paired and scoped callers over TLS.
This connects to a small design idea that runs through the whole app. When any external surface — the MCP server, an App Shortcut, the AI — refuses to make a change, it does not just say "no". It tells you why, and where to turn it on. A refusal might read: changes are off — enable them in the AI Administrator; or, for MCP, enable it in Remote Control & Lock ▸ MCP. The reason it points you to the app rather than offering to flip the switch itself is the core of the trust model: a remote agent can ask, but only you, at this Mac, can grant. A refusal is therefore never a dead end — it is a signpost to the one toggle that unblocks you.
18.6Getting help
Three resources back you up, in order of immediacy.
- The in-app Help window. Press ⌘? or choose Help ▸ FrontierStack Help for the built-in documentation, which leads with the AI features and covers every pane and service. Many panes also carry a ? button that opens Help at the matching section. Help's "Open in app" links jump you straight to the pane they describe — Help stays open while the main window comes forward.
- The website Help & FAQ. frontierstack.app/help mirrors the in-app documentation in a browsable form, and the FAQ answers the questions new users ask most. Migration guides live at frontierstack.app/migrate.
- Support & feedback. At frontierstack.app/support two short forms reach the team directly: a support request (include your macOS version) when something is wrong, and a feature request for what would make FrontierStack better. Both go straight to the people who build the app.
That brings the manual to a close. You have met FrontierStack as a control panel, a monitoring system and an AI administrator; you have stood up the web stack, linked a fleet, hardened the perimeter, wired up alerts, and handed the keys — carefully, on your terms — to an assistant that can see and fix your servers. The rest is doing. Keep ⌘? close for the in-app Help, visit frontierstack.app when you want the latest, and tell us at Support what you would like next. Thank you for running your servers with FrontierStack.