Chapter 11
Monitoring & Alerts
A continuous health sweep watches every service, device and subsystem you care about, and turns the first sign of trouble into a message on the app you already check.
A control panel that only lets you change things is half a tool. The other half is knowing when something has gone wrong — ideally before it becomes an outage. FrontierStack runs a continuous monitor sweep across everything you have told it to watch and turns the first sign of trouble into a message on whatever channel you choose. This chapter covers the Local Health board that summarises it all, the Alerts pane that raises and delivers warnings, the messaging gateways that carry them, and the specialised monitors for cloud services, project tools, power and storage.
11.1The Local Health board
Open Overview ▸ Local Health for the single screen that answers "is anything broken right now?" Every monitored service, device and subsystem appears as a row marked UP or DOWN, grouped by area — web and database services, the fleet, sites and certificates, disks, UPS and SNMP devices, connected cloud accounts. At the top sits a one-line summary in the form X up / Y down, so you can take in fleet-wide status in a glance without reading every row.
Groups are collapsible, but any group containing a failed item opens automatically. Select the history button on a row for its last 30 checks, measured response-time sparkline, exact rolling observed uptime over 24 hours, 7 days and 30 days, and recent transitions. Coverage sits beside each uptime value: app-off, paused and out-of-network time is unknown, never guessed as healthy. Fleet-wide Events retains at most 1,000 first observations, outages and recoveries for 31 days without storing endpoints, credentials or response bodies.
The board is the same data the AI Administrator reads through its get_server_health tool: ask it "what's down?" and it reports exactly what this screen shows, then offers to investigate before suggesting a fix (see Chapter 13). The sweep runs about every sixty seconds; each DOWN item is also attributed to the pane that owns it, which is why a red count capsule can appear on a sidebar row and on the Dock icon — you are told where the trouble is, not just that there is some.
11.2The Alerts pane: what is watched
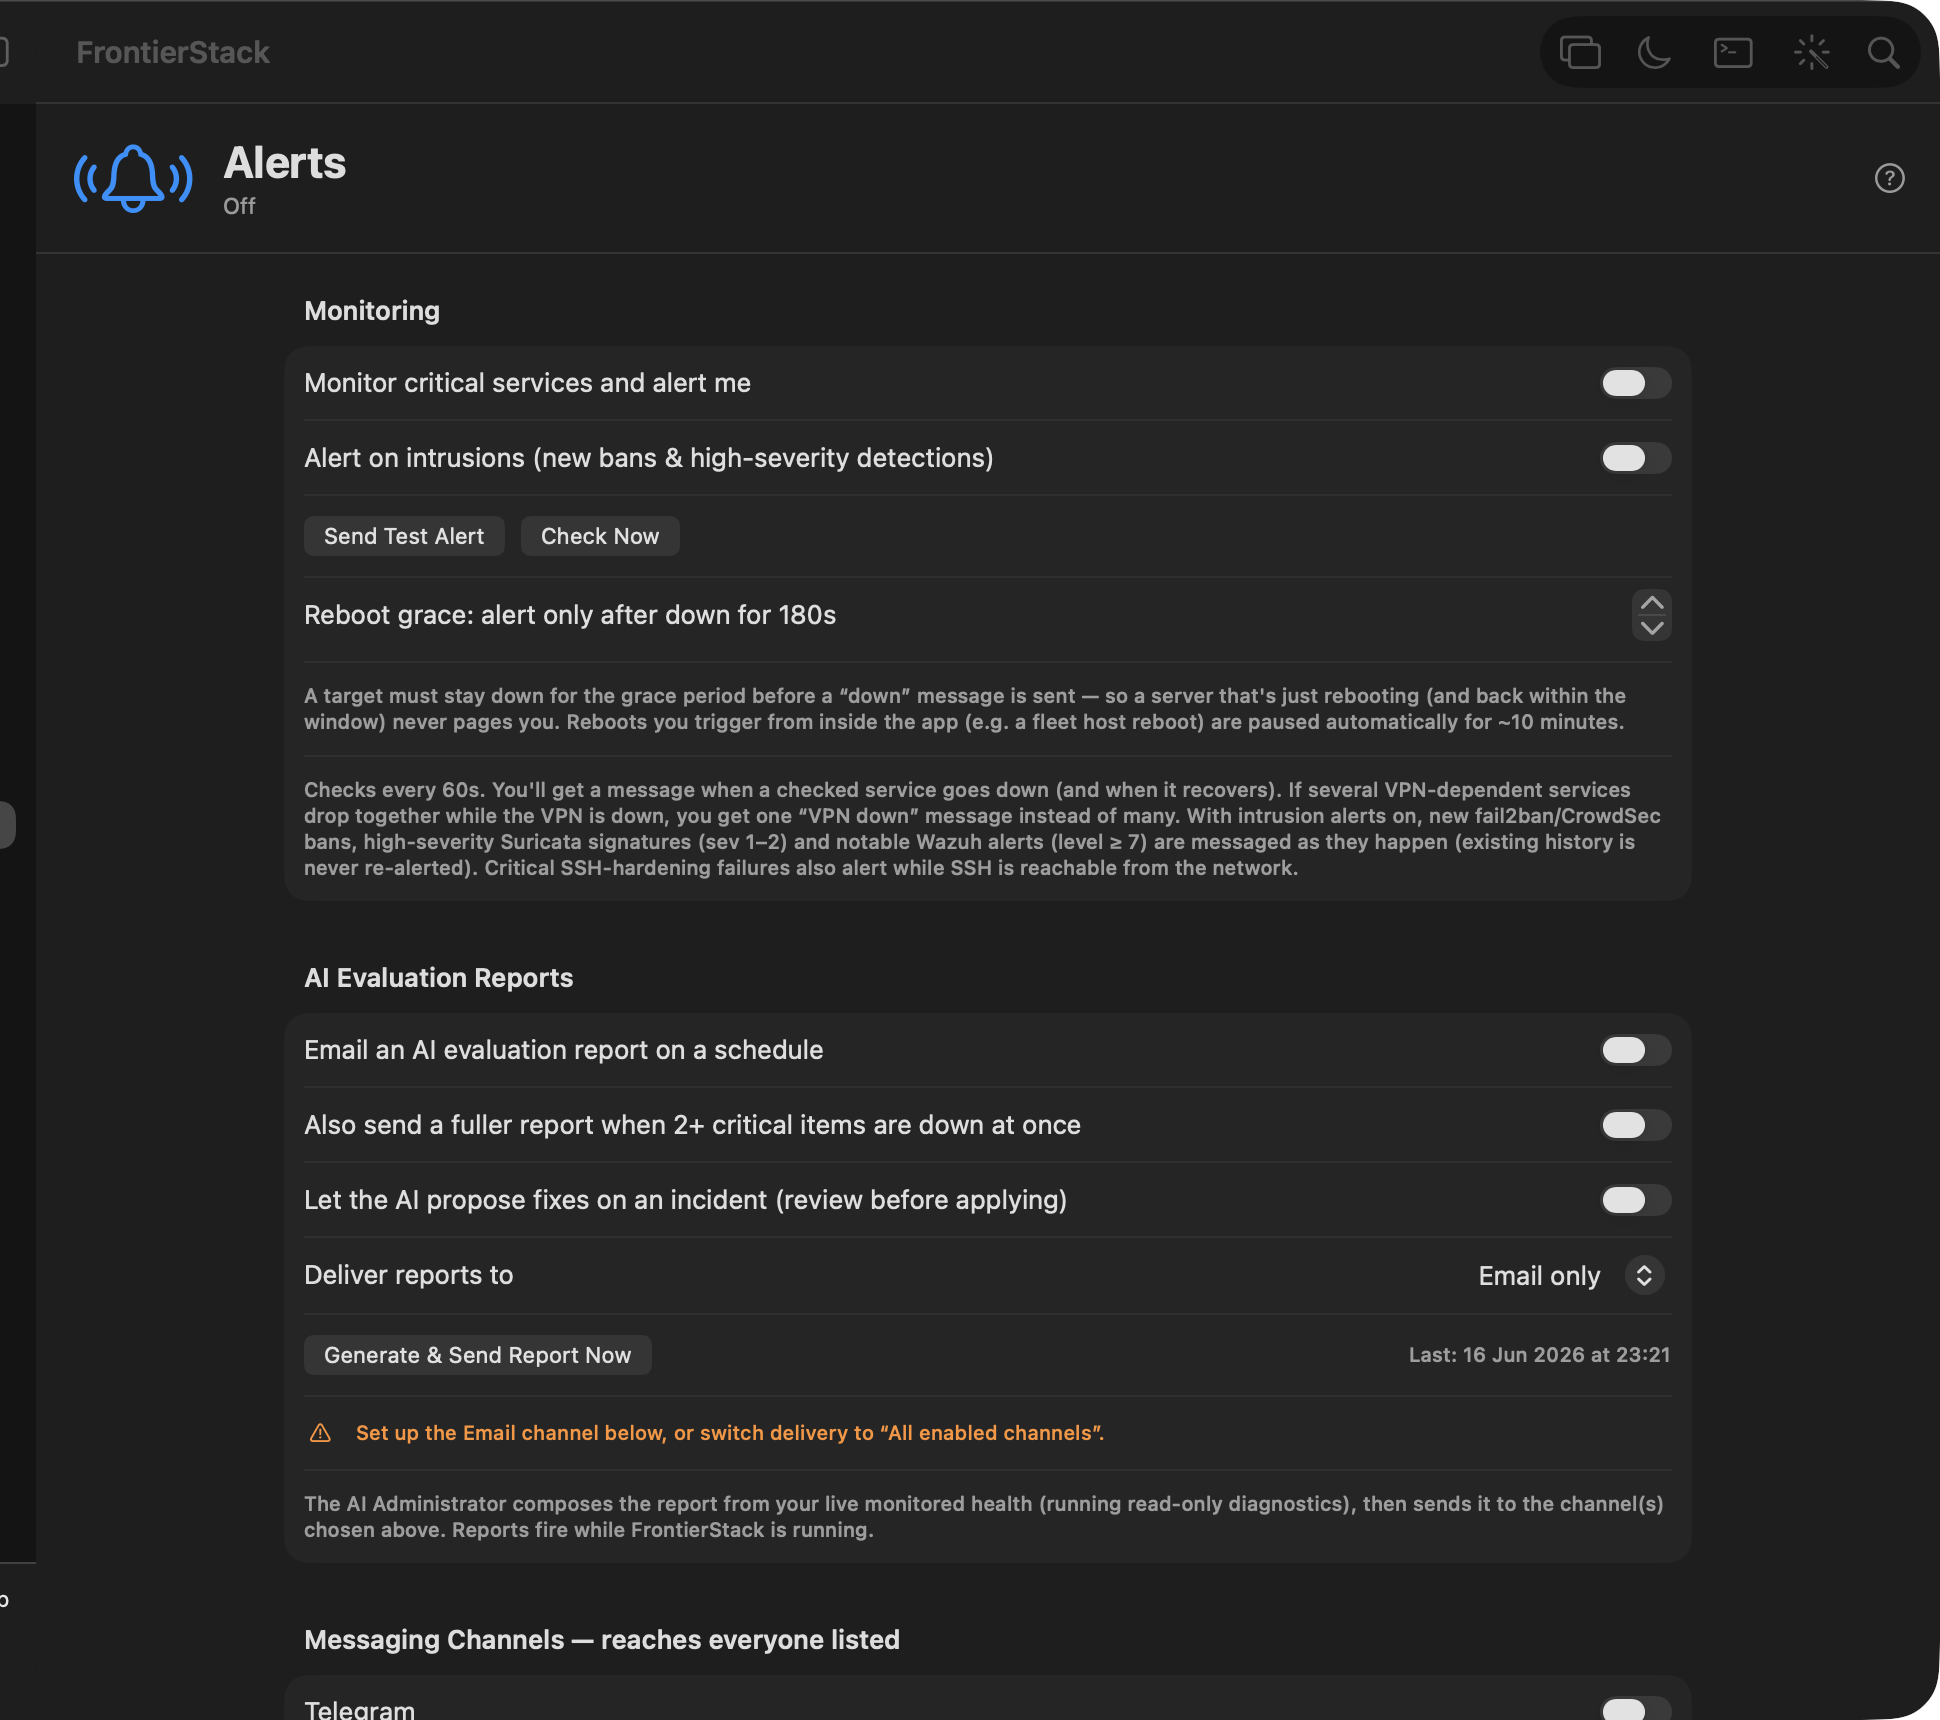
The Local Health board shows status; the Alerts pane (Overview ▸ Alerts) decides what is worth a message and sends it. Switch on "Monitor critical services and alert me" and the sweep starts raising alerts. What it watches:
- Site & service health — HTTP/loopback checks, TCP ports, and deeper protocol probes (an SMTP/IMAP login, a database
SELECT 1, an LDAP bind) so a service that is listening but actually broken still trips. The MySQL probe additionally reads the connection pool (current use vsmax_connectionsand the "too many connections" refusal counter): it alerts when the pool passes 90% or when clients were refused between sweeps, and every sweep is charted as Connection Health History in the Database Health pane — pool % over time with red lines marking refusal bursts and outages. - Linked servers — every fleet host's SSH endpoint is reachability-checked each sweep (a bare TCP connect, no login attempt), so a server that is completely off raises a plain "Server down" alert — and a "Server recovered" when it returns. This is separate from the SSH cool-down notice, which fires only when a host is up but rate-limiting connections.
- Certificates & domains — TLS expiry across the whole fleet, plus registrar / DNS / SSL checks that warn you days ahead rather than on the morning a domain lapses (Chapter 7).
- Disks filling up — a volume crossing its free-space threshold, surfaced from the Disk Health monitor below.
- Security exposure — a new open port or unexpected listener, a VPN tunnel drop, or a critical SSH-hardening failure while SSH is reachable from the network.
- Failed payments & billing — connected paid services (OpenAI, Anthropic, Cloudflare, Google Cloud) returning insufficient-quota, low-balance or auth errors — the symptom of a lapsed card.
- Connected cloud services — live monitors for Stripe, Shopify, Freshdesk, SendGrid and more, firing when a metric you chose crosses its threshold.
Most checks are threshold-based, so you decide what "trouble" means: alert when a certificate is within N days of expiry, when open tickets pass a number, when a disk crosses a percentage. Conservative thresholds turn a post-mortem into a heads-up. The pane also offers "Alert on intrusions" — new fail2ban/CrowdSec bans, high-severity Suricata signatures and notable Wazuh alerts (level ≥ 7) are messaged as they happen, and existing history is never re-alerted.
SwitchBot devices. Pinning a SwitchBot device watches it through the SwitchBot cloud. Plugs are read every 2 minutes and get the Wi-Fi-unstable warning; locks, sensors, curtains, Bots, lights, Hub 2/3 and other devices that report status are read every 10 minutes and alert when SwitchBot says the device, or the hub it connects through, is offline. Cameras and Hub Mini report no status and are never shown as offline. To stay inside SwitchBot's 10,000-calls-a-day quota the intervals lengthen automatically when many devices are pinned.
11.3Messaging gateways
An alert is only useful if it reaches you. The Alerts pane lets you enable several gateways at once and list multiple recipients per channel, so the right people are reached on the app they already have open. Paste a bot token or webhook URL, send a test, and you are live. The AI Administrator can enumerate the enabled gateways with get_messaging_channels and send through them with send_notification (Chapter 13).
| Gateway | Best for |
|---|---|
| Telegram | A bot token; multiple chats per gateway. Fast, free, reliable phone push. |
| LINE (Messaging API) | Reaching people who live in LINE, especially in Japan and Korea. |
| Slack / Discord | Incoming webhooks into a team channel; route ops alerts where the team already talks. |
| ntfy | Simple phone push via the public server or your own self-hosted ntfy. |
| Apprise | One extra hop that fans out to 80+ destinations (Pushover, Matrix, Gotify, Microsoft Teams, PagerDuty and many more). |
| Email (SMTP) | Anything that must land in an inbox; also carries the scheduled AI evaluation reports. |
| SMS / WhatsApp | Reaching a phone directly, via Twilio or the WhatsApp Business Cloud API. |
| Slack/Discord webhooks | Persistent team-visible history of every alert and recovery. |
| KakaoTalk | A "send it to me" alert for KakaoTalk users. |
| iMessage (Apple Messages) | A native "send it to me" alert straight from your Mac — no external service. |
| PagerDuty / Opsgenie (paging) | Real on-call paging with escalation — see below. |
11.16.1Paging the on-call (PagerDuty, Opsgenie, urgent ntfy)
The message gateways above are fire-and-forget text. The paging channels are different in kind: they are stateful. When a monitored item goes down, FrontierStack triggers an incident keyed to that item — PagerDuty (an Events API v2 routing key) or Opsgenie (a GenieKey) then runs your escalation policy, pushing, texting or phoning whoever is on call until someone acknowledges. When the item recovers, FrontierStack resolves the same incident automatically. Because the incident is keyed per item, a flapping service updates one incident rather than paging the rotation over and over, and nobody is woken for an outage that has already ended. Without an on-call service, the ntfy gateway's Page on down toggle sends "down" alerts at ntfy's maximum priority — a louder, repeating tone that overrides many phones' quiet settings — while recoveries and reports stay at normal priority. Each paging channel has a Send Test Page button that triggers a real incident and auto-resolves it about ten seconds later, proving the whole escalation path end to end.
11.16.2Telling someone else: contacts, presets and escalation
The channels above reach you. Many incidents also need someone else: a supervisor who wants an email, a second support person, or the technician who has to go to the site. Alerts ▸ Contacts & Escalation handles this in three parts.
| Part | What it is |
|---|---|
| Contacts | People other than you, each with a name, a role (Supervisor, On-site technician…) and the addresses you will use: email, mobile number (texts and phone calls), WhatsApp, Telegram chat ID, Messages handle, ntfy topic or LINE user ID. |
| Presets | Reusable recipes that say who gets told, by what method, and when. Each step names a contact, one or more methods, a delay, and whether it is urgent. A preset can also carry instructions added to every message, such as “Go to the server room, B1 rack 3”. |
| Rules | Which alerts use which preset: every alert, a category (Storage, Network & Routing…), a location, or one monitored item. Every matching rule applies, and anyone named by two rules is told once. |
For example, the preset Email the supervisor, page the on-site tech sends the supervisor an email and gives the technician a text and a phone call that reads the alert aloud. Tech now, supervisor if not fixed in 30 min is an escalation: the supervisor's step runs only if the item is still down 30 minutes later and nobody has pressed Acknowledge. Pending escalations are listed in the section and in the Alerts palette (Ack), and each one is cancelled automatically when the item recovers. People who were told something broke are told when it is fixed; nobody gets a phone call for good news, so an all-clear goes by text instead. Choose New Preset ▸ Start from a template to use a ready-made preset. It adds a blank contact for each role you don't have yet. Test sends every step at once, marked TEST, with delays ignored.
Contacts use the gateways you have already set up, with their own address in place of yours. Emailing a supervisor uses your SMTP account, and texts and calls use your Twilio number, which must be able to make voice calls. Those gateways can stay switched off for your own alerts. Each message states the contact's role, the location, and the preset's instructions, so the person understands why they received it. A missing address or an unconfigured gateway appears in Delivery Errors as, for example, SMS → Alex (On-site technician). A network failure is retried twice, two minutes apart, before it is reported.
IFTTT. Turn on IFTTT (Webhooks) in Messaging Channels to fire an IFTTT applet on every alert: value1 is the title, value2 the message and value3 is critical for a down alert or info otherwise. Give down alerts their own event name to trigger something louder, such as flashing lights, than a recovery does. A contact can also have their own Webhooks key, so a preset step fires an applet on their account. IFTTT's Webhooks service needs an IFTTT Pro plan.
Tokens and webhooks live in the macOS Keychain and never leave your Mac. You can also send a scheduled AI Evaluation Report: the AI Administrator composes a summary from your live monitored health (running read-only diagnostics) and emails it daily or weekly, or pushes it to all enabled channels — with an optional fuller report whenever two or more critical items are down at once.
11.4Delivery errors and how to fix them
A monitor is worthless if its alerts silently fail to send. FrontierStack verifies every send: when a gateway fails, it is recorded in the Delivery Errors section of the Alerts pane with plain-English fix-it guidance, the raw error underneath, and a Fix button that scrolls straight to the misconfigured channel's settings. A red badge appears on the sidebar's Alerts row and on the Dock icon so you actually notice, and it stays until you clear it. The AI Administrator reads the same list through get_alert_errors, so you can simply ask "why aren't my alerts arriving?"
The common causes are mundane and quick to fix:
| Symptom | Likely cause & fix |
|---|---|
| Email rejected at send | A blank SMTP From address, or a missing recipient — fill both in the Email channel. |
| Email connection refused / times out | Wrong port or transport; match your provider (587 STARTTLS or 465 SSL) and host. |
| Telegram / Slack / Discord 401 or 404 | A bad or revoked token / webhook URL — paste a fresh one and send a test. |
| Reports never arrive | Report delivery is set to "Email only" but no Email channel is configured — switch to "All enabled channels" or set up Email. |
11.5The on-host Service Watchdog & database health
The monitors above run on your Mac. For a critical server you also want a watchdog that lives on the box itself, so it keeps working when your Mac is asleep, offline, or simply not the machine that failed. FrontierStack's Service Watchdog is deployed with the host monitor (Chapter 8): it health-checks a service on a short interval, restarts it when it fails, and — as a last resort, and only when you have allowed it — reboots the machine, with a minimum-interval guard so a still-broken service can't cause a boot loop. Each watch has a check type: a process check, an HTTP or TCP probe, or a purpose-built MySQL or PostgreSQL check.
11.16.3A recovery ladder for pinned servers
The pinned server's Service Watchdog panel can add two opt-in steps after ordinary on-host service recovery. Reboot from FrontierStack lets the Mac issue one verified reboot after a new Recovery exhausted event. You choose the delay. If a controllable outlet is linked in Power Control, the next step can power-cycle the server after it remains completely unresponsive for the chosen period. FrontierStack waits 90 seconds after the reboot attempt before judging the host, and the power timer has a five-minute minimum.
The hard-power test is deliberately stricter than a failed SSH login. The Mac must have a healthy network path, and the server must have no SSH response, no healthy monitor report, no ping or ARP evidence, and no response on the common service ports. Any sign of life cancels that incident. A power cycle runs once, then the ladder stops. Old watchdog events are marked handled when you enable the policy, and watchdog_reboot_suppressed remains final, so the app cannot defeat the helper's boot-loop protection.
11.16.4Keep watching while the Mac is closed
A wedged server cannot reliably operate its own smart plug. Choose a different enrolled server under Recovery observer to put the last step on that machine's helper. The observer keeps probing the target by private IP, ping, and several TCP ports even when FrontierStack is closed. It first confirms that the private power controller answers its status request, persists an anti-loop receipt, cuts power for the configured dwell, restores power, and performs no second cycle until it has seen the target alive again. A persisted 30-minute cooldown also survives an observer restart.
fsck, xfs_repair, chkdsk and similar filesystem tools can temporarily stall every service on the system disk. Both the local Service Guardian and the on-host Service Watchdog recognise those repair processes and pause automatic recovery — including service restarts and remote reboot escalation — without changing your saved policy. Failure counters are cleared, and recovery waits another 60 seconds after repair ends before starting fresh. The desktop and phone show the hold. A manually confirmed service control remains available if you deliberately need it.The database Heartbeats catch failures a process/port check misses. A MySQL Heartbeat asks for SELECT 1 without a password. Success or “access denied” proves that MySQL answered; a refused, timed-out or saturated connection is unhealthy. No MySQL password is stored and no tables are read. A blank probe name becomes the non-root fs_watchdog, which need not be a real account. A PostgreSQL Heartbeat uses pg_isready without a database username or password. With error-log early-warning switched on, the watchdog also tails the database's own error log and raises a critical event the first time it sees a corruption signature. Because all of this runs on the server, it can alert you autonomously over ntfy or a webhook even while your Mac is off; turn that on with Alert me directly from this server in the host's Service Watchdog panel.
Aborted_connects — about two a minute, several thousand a day. Nothing is wrong: the server is healthy and the check is doing its job. But the counter fills with the Heartbeat's own traffic, which can hide a real signal such as a brute-force attempt or a misconfigured app. The MySQL Heartbeat panel offers an optional fix: create fs_watchdog@localhost and [email protected] with an empty password and no privileges at all (USAGE only — the account can read nothing and cannot connect from off the server), so the probe logs in cleanly and is counted as an ordinary connection. FrontierStack creates it only when you ask, using the MySQL administrator password you saved in Database Health, and shows the exact CREATE USER statements before running them; you can copy the SQL and run it yourself, or remove the account later from the same panel. Leaving it alone is a fine choice — the count is cosmetic.mysqlcheck integrity scans, verified backups and optional auto-repair, choose Open table checks & auto-repair in the watch or open Database Health, then expand the database's Scan & repair settings. Use a dedicated account such as frontierstack_health@localhost, never root. Grant USAGE for login and SELECT 1; add PROCESS only for fleet-wide connection visibility and SELECT only on schemas you explicitly inspect. Restrict the account to localhost or the monitor's exact private address. FrontierStack runs the client on the server, so there is no reason to expose MySQL to the wider network.To create a check-only account, replace your_database and the example password:
CREATE USER 'frontierstack_health'@'localhost' IDENTIFIED BY 'use-a-unique-random-password';
GRANT SELECT ON `your_database`.* TO 'frontierstack_health'@'localhost';
Save that login in Database Health. Leave auto-repair off until both a manual check and verified backup succeed. If a complete backup or repair needs another privilege, add only the schema-scoped privilege MySQL names; never use *.*. For a monitor connecting from another machine, replace localhost with that one exact private address.
The pinned server's Services row shows a green DB checker: On dot while scheduled table scans or server self-heal are active, Paused when a target exists but neither is running, and an orange Needs login instead of green when a selected MySQL scan has no database password. Database Health and the Heartbeat are complementary: the former checks tables on a slower schedule, while the latter detects outages quickly and can restart MySQL on the server.
When a database isn't down but is slow or stuck, the Why slow/stuck? button on each target in the Database Health pane answers it on demand: it reads the server's live activity (SHOW FULL PROCESSLIST on MySQL, pg_stat_activity on PostgreSQL), groups the running queries by shape so a burst of the same query collapses to one line with a count, and states the verdict — a single query hammered in a burst, a long-runner blocking others, connections waiting on a lock, oversized result sets streaming to clients (the bandwidth cost), or connections near the ceiling. A useful subtlety: if the load is bursty it may read idle between spikes, and the tool says so and tells you to re-run during one, rather than falsely reporting all-clear. Remote targets are probed over SSH, so no database port need be exposed.
11.16.5Pausing checks for maintenance
A watchdog that restarts things is exactly what you don't want while you are deliberately taking a service down. Rather than switching protection off — and relying on yourself to remember to switch it back on — use Pause Checks… in the Guardian's header, or the pause button on an individual service row. Choose a window from 15 minutes to a day.
While paused, the Guardian stops health-checking and stops restarting whatever you paused, so your work doesn't fight it. Nothing is disabled and no setting is lost. Keep Alive, Auto Recover, thresholds and intervals are all left exactly as they are, and checking resumes on its own when the window ends — or immediately, if you press Resume Now. A pause never survives its own window, even if you quit and reopen the app.
11.6Case study: the High Sierra Server.app serviceproxy wedge
Old Macs still running macOS Server (Server.app) on High Sierra have a well-known failure: the web front proxy — the launchd job com.apple.serviceproxy, which binds ports 80/443 in front of the real backend — occasionally wedges. It keeps accepting TCP connections but never answers them, so every website behind it goes dark while every process check still looks healthy. There is no fix from Apple; the stack is end-of-life. The Service Watchdog was built with exactly this case in mind.
How to set the watch up. On the server's pane, add a watchdog entry for the service name serviceproxy and — this is the important part — give it an HTTP check with the target http://127.0.0.1/, not a process check. The HTTP probe is the only check that sees the real failure (connections accepted, no answer); on failure the watchdog heals it with launchctl kickstart, which is precisely the manual fix an admin would type. Any HTTP status below 500 counts as alive (a 403/404 from the proxy still proves it is answering); each probe times out after 6 seconds, so a wedged proxy fails the check by timing out. The backend behind the proxy can be watched the same way as server-httpd.
Timings that work well. Check every 30 seconds; restart after 3 consecutive failed checks; try up to 3 restarts; leave the post-restart grace at its default (~20 s, generous enough for Apache on old hardware). That confirms a wedge for ~90 seconds before acting — long enough that one slow response or a momentary load spike never triggers a kickstart, short enough that sites are back about two minutes after a real wedge, hands-off. If the sites are critical, tighten to a 15–20 s interval with 2 failures (≈40 s to confirm) — going tighter than that mostly buys false restarts, because a genuinely slow old box can take a few seconds to answer under load. Leave “Reboot the server if recovery still fails” off unless the machine is truly unattended: a kickstart resolves the wedge in practice, and reboot-as-last-resort on a box like this mostly adds downtime (the anti-boot-loop guard enforces at least 30 minutes between watchdog reboots regardless).
Why not a process check? There is no process named serviceproxy — the job runs as httpd with a special config — and monitors older than v1.6.1 read a healthy proxy as permanently “down” because of that, restarting it over and over and, if reboot escalation was allowed, rebooting a healthy machine on a schedule. From v1.6.1 the monitor asks launchd for the job's real state instead, so a process check now tells the truth; the HTTP check remains the one that catches the actual wedge. If an older server of yours has been rebooting with no visible cause, check its monitor version first — and note that “Why did it reboot?” attributes watchdog-initiated reboots explicitly (with the reason, on v1.6+ monitors; older monitors leave a stamp that is still reported).
serviceproxy altogether: the Apple Server Migration wizard (Chapter 8) inventories a Server.app machine and moves its websites to a plain Apache on a supported system, taking the wedge-prone proxy out of the serving path. Until then, the HTTP watch keeps the old box honest.One guarantee closes the loop on delivery: an alert is never silent. On top of the messaging gateways, every state-change alert also raises a native macOS notification and push, independent of the gateways — so even with email off and every channel disabled, a service going down still reaches you on the Mac. Database recovery — running mysqlcheck/pg_amcheck and the AI-guided rebuild — is covered in Chapter 5.
11.7Incidents, on-call and status pages
For teams that already run formal incident response, FrontierStack connects to the tools you use rather than replacing them. Each has a live pane reached from its catalog entry: paste a read-only API key and it shows current state.
- Incident management & on-call — PagerDuty (open and high-urgency incidents, who is on-call, services), Opsgenie (open/unacknowledged alerts, with a US/EU region toggle), incident.io and Rootly (active incidents).
- Status pages — Statuspage (unresolved incidents and components that are down) and Better Stack (monitors up / down / paused).
Set up the key in each pane (for example PagerDuty ▸ Integrations ▸ API Access Keys) and the pane confirms the connection. These feed the same monitoring picture, so an open PagerDuty incident or a down status-page component shows alongside your own health.
11.8SaaS live monitors & project-management panes
FrontierStack does not stop at infrastructure. A config-driven SaaS live monitor watches connected cloud accounts and refreshes every few minutes. Each service has a credentials form, live metric tiles, an "Alert me" toggle and a threshold; alarmable services raise a DOWN alert when the metric crosses the line, and the rest are watched for reachability. Live monitors include Stripe (disputes needing response, balance), Shopify and WooCommerce (open orders), Freshdesk and Zammad (open/pending/overdue tickets), SendGrid, Mailgun and Postmark (bounces and blocks), GitHub Copilot (inactive seats), and identity providers Okta and Microsoft Entra ID. Pin a service to make it always-on-Local-Health regardless of its alert setting.
The dedicated GitHub pane adds account and repository totals, Actions-related work, PRs, requested reviews, assigned issues, unread notifications, API requests remaining and release-asset download counts from the five most recently updated repositories. Anthropic account/model monitoring and GitHub Copilot seat usage need only their API credentials; no host or port is invented for a cloud-only service.
AppSignal has a dedicated read-only live connection. Enter the application ID and a personal API token; the token is stored in Keychain and FrontierStack uses AppSignal’s GraphQL API to show open error incidents, active uptime alerts, the latest deploy and available last-hour error/latency metrics. The alert threshold combines open incidents and uptime alerts. AppSignal requires its API token in the GraphQL URL, so FrontierStack constructs the URL privately and never writes the authenticated URL to logs. For deeper investigation, add the AppSignal preset in MCP Servers: it opens AppSignal’s hosted MCP through a version-pinned OAuth bridge, without copying the monitoring token into an AI client. Keep AppSignal access read-only until you have reviewed any write-capable tool.
Paessler PRTG has a dedicated live connection for both a self-hosted PRTG core and PRTG Hosted Monitor. Open the PRTG service, enter its HTTPS base URL, and create a Read access scripting key under Setup ▸ Account Settings ▸ API Keys. FrontierStack stores the key in Keychain, reads a bounded sensor-status table, and shows Up, Down, Warning, Paused and other sensor totals. Turn on Alert me when this needs attention to feed Down sensors and sensors without a connected probe into Alerts. The integration never acknowledges alarms or changes devices, sensors or probes. PRTG Network Monitor and Enterprise Monitor run their core service on Windows; use the linked Windows server and vendor installer, or use Hosted Monitor. Remote Windows probes and multi-platform probes extend collection into the rest of the fleet.
NinjaOne, Atera and Site24x7 also have dedicated read-only live connections. NinjaOne uses a Client Credentials application with Monitoring scope to summarise devices, offline endpoints, active alerts and running jobs. Atera uses a targeted API key limited to Agents and Alerts. Site24x7 exchanges a read-scope Zoho refresh token in the account's regional data centre and reads current monitor states. Their secrets remain in Keychain, responses are size-bounded, and none of these connections patches endpoints, runs jobs, closes alerts, starts maintenance or changes vendor configuration.
The same pattern gives project-management tools live token-login panes: Jira (open / unassigned / blocked / in-sprint counts), Linear, monday.com, OpenProject, Plane and Taiga. These are dashboards rather than alert sources, but they put your team's workload in the same window as the servers that run it. Email delivery has its own unified Email Delivery pane that combines transactional-provider metrics with SPF/DKIM/DMARC checks (Chapter 7).
11.9Queue Operations
Queue Operations is a read-only dashboard for RabbitMQ, Kafka, NATS/JetStream, Redpanda, AWS SQS, Azure Service Bus, Google Pub/Sub, Celery/Flower, Redis Streams, Apache Pulsar and Apache RocketMQ. Add one monitor for each broker, namespace or cloud account. FrontierStack shows queue or consumer-group names, ready and in-flight counts, consumer counts, lag, dead-letter counts and oldest-message age when the provider exposes them. It never reads or stores message bodies.
Client and administration ports are kept separate. For example, RabbitMQ clients use AMQP on 5672 while its management API normally uses 15672; NATS clients use 4222 while monitoring normally uses 8222; Pulsar clients use 6650 while its HTTP admin API uses 8080. Keep monitoring endpoints private. Use TLS and a monitoring-only account whenever the dashboard is not reached through the on-host FrontierStack monitor.
For a linked server, select its installed monitor and FrontierStack asks the credential-free helper for bounded summaries over the signed connection. Cloud providers use their normal local CLI profiles or a scoped credential saved in Keychain. Critical thresholds join the Alerts sweep, the same sanitised summaries are available in the iPhone/iPad app, and the AI Administrator can answer queue-health questions through the read-only get_server_health tool. The dashboard has no purge, delete, publish, acknowledge or replay action.
11.10UPS monitoring and SNMP devices
Open Power Control and use its UPS section for battery-backup monitoring. FrontierStack reads USB UPS devices directly from macOS power sources, queries NUT with upsc, and queries APC devices through apcupsd with apcaccess. These paths cover APC, Eaton, CyberPower and Vertiv, including Liebert models, as well as other devices supported by macOS or NUT. NUT can also expose serial and network UPS devices.
NUT is free, open-source software and requires no subscription. Status reads need no API key, so the NUT service pane intentionally has no API-credential or Plan & Cost card. A dedicated NUT command login is only needed when you opt into reviewed UPS controls; paid support or hosted dashboards are separate products.
The same pane supports switchable Raritan / Legrand Xerus PDUs. Add the private HTTPS address, the number printed on the outlet, and a dedicated account limited to outlet control; its password stays in Keychain. FrontierStack reads the exact outlet state and genuine active-power sensor when present, supports On and Off, and uses Xerus's atomic cyclePowerState method for Cycle. It refuses public addresses, embedded credentials, redirects and arbitrary JSON-RPC methods. Off and Cycle show a fresh destructive-action confirmation, and the AI Harness receives the same confirmation gate.
Each row shows the readings supplied by that model: charge, estimated battery runtime, load, real power in watts, input and output voltage, battery voltage, frequency and temperature. A watt value reported by the UPS is shown directly. If the device reports rated real power and load percentage but not current watts, FrontierStack shows a value marked estimated. It does not treat volt-amperes as watts.
Turn on Alerts, then set the charge, runtime and load thresholds. Utility-power loss, low runtime, low charge, high load, a battery-service warning, forced shutdown and communication loss are tracked separately. This means a falling-runtime alert can arrive after the first on-battery alert instead of being hidden by the existing outage. A disconnected unit remains visible as Comms lost. Pin a UPS to keep its overall health in Local Health and on the Places map. The NUT and apcupsd install buttons add those optional tools when needed.
Battery shutdown rules can now carry out the whole orderly sequence: wait until the UPS has been on battery for a chosen time or falls below a charge threshold, stop named managed services and VM services in order, verify each stop, and shut down the protected host last. A failed verification halts the ladder with the host still running; returning utility power cancels the unfinished stages. If PowerChute Network Shutdown should be running on the host, FrontierStack can detect common service names or accept a manual declaration, alert separately when it disappears, and either stop or continue the configured fallback.
A scan waits for NUT and apcupsd to answer. While it is running, Stop abandons the wait, keeps readings already found and pauses automatic refresh until you press Refresh.
A server or ordinary pinned device has two separate setup dialogs in its Power section. Add power control… is for the switchable path: a SwitchBot Plug, a configured Home Assistant, Shelly, Tasmota, private HTTP, Raritan PDU or Anker SOLIX outlet, a command-based PDU, or a power-capable Remote KVM. The dialog also links directly to the SwitchBot, Home Assistant, Anker SOLIX and TP-Link Kasa/Tapo provider panes; providers configured natively in Power Control open there. Add backup power… is for a pinned monitored UPS, Mini DC UPS, or Unmanaged / dumb UPS. Treat a PDU as a controller: assign every physical outlet its printed number in Power Control, then select that named, numbered outlet for the server or device. A pinned PDU is also offered for command-based control, whose exact outlet number and commands are entered directly in the server's Power section. SwitchBot remotes and sensors are excluded. A protected device may have both a smart plug and a dumb UPS. A device marked as a Smart Plug is itself a power controller, so its pane omits the entire Power section rather than offering another controller. A linked monitored UPS contributes real battery, runtime and warning status. Unmanaged choices take maker and model notes and remain inventory-only, so FrontierStack and the AI Harness expose no invented readings or controls. TREEDIX is available for its 5 V Raspberry Pi UPS controller as a Mini DC UPS.
Outlet reachability. In Power Control, edit an outlet and turn on Alert when this outlet is unreachable. FrontierStack checks the outlet every 2 minutes with a read-only probe and alerts after 2 missed checks in a row. It does this only while this Mac is on the same physical network, identified by the router's hardware address, where the outlet last answered. A laptop away from home, or on a network that reuses the same addresses, is never told its plugs are dead. For plugs this Mac can't reach, use the Shelly Cloud pane (IoT). Paste the authorization cloud key and server address from the Shelly app, add each device ID, and turn on the bell for offline alerts. When a Shelly is watched both ways, the local check wins while you are on its network.
11.16.6Link a device to a numbered PDU outlet
- In Power Control, add one outlet record for each physical PDU socket you want to use. Give it a useful name and enter the number printed beside that socket; for example, Rack server · Outlet 4.
- Open the pinned server or device, expand Power, and choose Add power control…. Configured outlets appear by name and physical number. Select the exact outlet feeding that device.
- If no configured outlet is available, choose Add a smart plug or PDU in Power Control…. FrontierStack opens the setup pane so you can supply the controller's private IP address or URL and add its outlets; it does not create an empty PDU link.
- If a PDU with an address is already pinned but has no native FrontierStack outlet integration, select it under Command-based PDU / powerboard. Enter that device's outlet number plus the reviewed On and Off commands in the server's Power section. The commands are configured there, not in the selection menu.
- Choose Add backup power… separately for a UPS. A pinned UPS appears there because it describes the device's backup supply; it is not the switchable PDU outlet.
Do not link the server to the PDU as a whole when individual outlets can be identified. FrontierStack includes the outlet number in the row label and in destructive-action confirmations, so the operator can verify the physical socket before an Off or Cycle action.
11.11Remote KVM platforms and power
The Remote KVM pane records multiple PiKVM, JetKVM, TinyPilot, NanoKVM, Raritan Dominion, ATEN, Vertiv Avocent, Lantronix Spider/SpiderDuo, Adder, GL.iNet, AWERAY and generic KVM-over-IP appliances. Each record keeps its exact model or firmware, can be pinned, and opens its private browser console; AWERAY records launch the selected companion app.
Power control is exposed only when a reviewed path is configured. PiKVM uses its documented local ATX API and checks that ATX is enabled, idle and in the expected current state before sending a hard action. JetKVM uses the shared MQTT connection with one exact base topic: it reads the retained ATX state before a short or long press, while its DC extension uses explicit ON and OFF messages; commands use QoS 1 and are never retained. TinyPilot and NanoKVM power hardware, and the enterprise vendors' PDU integrations, differ by model and firmware, so those records remain console/inventory-only unless an explicit private endpoint is supplied. A Raritan PDU associated with a Dominion target should use the reviewed Xerus entry in Power Control. KVM Off and Cycle require fresh confirmation in both the pane and AI Harness.
11.12Home Assistant entity monitors (Beta)
If Home Assistant already runs your building, FrontierStack can watch what it sees. Open the Home Assistant service pane, enter its URL and a long-lived access token, and the Entity Monitors section appears. Press Load Entities from HA, pick an entity, and give it a rule: numeric (is above / is below) for a temperature, humidity or power reading, or text (equals / is not) for a binary sensor's on/off, wet/dry or home/not_home state. Each watch becomes an ordinary Alert, checked on the usual sweep.
This is the right home for the sensors that can never be pinned as devices. A Zigbee leak sensor under the server-room floor, a Z-Wave door contact on the rack, a Bluetooth thermometer — none of them has an IP address, so none can be pinged. Home Assistant already speaks their protocols, so their readings arrive through it. Home Assistant 2026.9's shared Modbus bus access extends the same idea to solar inverters, PDUs and energy meters: HA polls the bus and FrontierStack reads the named values, rather than the two products fighting over one serial connection.
Two deliberate behaviours. An entity reporting unavailable or unknown raises its alert instead of being skipped — a leak sensor that has gone quiet is exactly the one you need to hear about. And the monitor is read-only by construction: it never calls Home Assistant's service API, so it can read your building but cannot switch a light, unlock a door or open a valve. Switching stays in Power Control, where every action is explicit and confirmed.
Unavailable devices. Rather than watching entities one by one, turn on Alert when any device becomes unavailable. Once a minute FrontierStack reads every entity in the domains you choose and alerts on any that Home Assistant marks unavailable. An entity that is merely unknown (no value yet) doesn't count, and nothing is reported offline while Home Assistant itself is unreachable. Alert after (default 10 minutes) keeps short blips and HA restarts quiet. If many entities fail together (more than 30% or more than 50), you get one alert, "Home Assistant: N devices unavailable", instead of dozens, because the cause is usually the same: HA restarting, a Zigbee/Z-Wave bridge down, or the network. Use Exclude (or the button on each row) for retired devices you haven't deleted from HA.
The same connection powers Import from Home Assistant in Device Discovery: the network devices HA tracks, listed with the names you gave them there, pinned in one click — individually or all at once. Imported devices behave exactly like scan results, with health checks, Places and licence limits applying as normal, and anything already pinned filtered out. Both features are marked Beta while Home Assistant 2026.9's device-registry API settles; importing full registry detail (areas, models) waits for that.
For anything else that speaks SNMP — managed switches, printers, network UPSes, NAS units — the SNMP / OIDs section of a device's detail pane queries it directly. Choose legacy SNMPv2c or SNMPv3; the recommended v3 profile uses SHA authentication with AES privacy. Passphrases remain in Keychain and are passed to net-snmp through an owner-only temporary configuration file, never command arguments. Pick a built-in template (System, Host Resources, Interfaces, Printer RFC 3805, UPS RFC 1628, Synology, QNAP, APC PowerNet) and press Query for a label-and-value readout, or fetch a single custom OID by hand. You can also watch an OID: set a comparison and threshold and FrontierStack polls it and raises an alert when the condition is met.
11.13Zigbee and Z-Wave devices
Offline alerts. On the Zigbee pane, click the bell on a device (or Alert on All) to be alerted when it drops off the mesh. With Zigbee2MQTT this needs availability turned on in Zigbee2MQTT's settings. Without it the pane shows an orange note, because FrontierStack can't tell a quiet device from a dead one, and it never guesses. deCONZ reports reachability for lights. Watched devices are checked every minute, even with the pane closed.
The Zigbee pane also watches Z-Wave nodes driven by Z-Wave JS UI. In Z-Wave JS UI, enable the MQTT gateway (Settings ▸ MQTT) on the same broker Zigbee2MQTT uses and keep Retain on. Then turn on Z-Wave JS UI via MQTT in the pane's Z-Wave section and enter the same prefix (default zwave). Each node shows as alive, awake, asleep or dead; ring its bell to be alerted when it goes dead. A sleeping battery node is normal and counts as up. If the gateway is offline, has not reported, or the last read is more than five minutes old, every node shows as unknown and no alert fires — FrontierStack never reports an unknown state as offline.
The same SNMP profile is used by Device Discovery, Network Path and PoE monitoring. PoE writes use SNMPv3 when the configured user has write permission; SNMPv2c keeps its separate per-switch write community. The AI Harness can inspect the non-secret profile, read numeric OIDs from pinned devices and list PoE state. Its write tool has no arbitrary OID operation: it is limited to reviewed PoE on/off/cycle actions, needs changes enabled and pauses for a fresh visible manual confirmation.
11.14Music Assistant
Music Assistant is the Home Assistant team's music server: streaming services and local files in one library, played on AirPlay, Google Cast, Sonos, Squeezebox, Snapcast and DLNA speakers. When it fails, nothing crashes — a streaming login expires, an upgrade breaks a speaker integration, a speaker drops off the network — and nobody notices until the music doesn't start. Open the Music Assistant service pane (Home Automation), enter the server URL (usually port 8095) and a long-lived access token from Music Assistant ▸ Settings ▸ Profile.
On every Alerts sweep the monitor checks three things: that the server answers and accepts the token; that no music or player provider has failed to load or needs signing in again; and that the speakers you switched to Alert when offline are still available. Speakers are opt-in because phones and laptops come and go all day. The monitor only sends list commands, so it can never start playback, change volume or edit settings.
Service Scan and Discover Services recognise a Music Assistant server on port 8095 from its /info response and show its version, rather than guessing from the port alone.
11.15Disk, RAID and SMART health
Drives fail with warning if you are listening for it. The Disk Health pane (a built-in monitoring tool) combines several layers. Volume space and Time Machine status are always shown. With smartmontools installed (a one-click Install button), each physical drive is enriched with deep SMART attributes — health, temperature, power-on hours, reallocated and pending sectors, and predicted-failure flags — visible per drive with a Check button and a Details sheet for the raw report. A drive trips an alert on a SMART failure or on concerning attributes (reallocated/pending sectors or a predict-fail), not only on outright death.
Software AppleRAID sets (mirror, stripe, concat) appear in their own section with level, status and per-member state; an alert fires when a set is degraded or a member drops offline. Under Alerts & Thresholds, switch on disk alerts and they route to your channels exactly like every other monitor.
Taken together, these monitors give you one board to glance at, one pane to tune, and one set of channels to reach you on — and an AI Administrator (Chapter 13) that reads the same health and sends the same notifications on your behalf. The host monitors that feed fleet-wide CPU, memory and GPU metrics into this picture are covered in Chapter 8.
11.16The Server Activity window
When you want to watch every box at once rather than configure one, open Monitors ▸ Server Activity Window (⇧⌘A, or the gauge button in the toolbar). It is a separate window holding only your pinned servers and the pinned devices that can report live state — routers and firewalls, UPS units, PoE switches, mining rigs, KVM consoles and smart plugs — and none of the rest of the app. Each tile shows the metrics you asked for with a sparkline and a status dot, and turns orange or red when something needs attention.
Layouts decide what is on the board: the built-ins are All Servers, Macs, a compact Cluster grid sorted by CPU, Mining Rigs & GPUs, Network & Power and Everything. Customise a copy or make your own — kinds of target, a server filter, individual members, the metrics and their order, tile size, grouping, sort and the sampling interval. Readings come from the FrontierStack monitor where one is installed and otherwise from one SSH round-trip; sampling runs only while the window is open.
| Tab | What you can do |
|---|---|
| Overview | KPIs, usage charts (live, or 24 h / 7 d from the monitor), network and temperature charts, system facts, top processes, posture chips. |
| Processes | Sort, search, kill or force-kill. |
| Services | systemd / launchd / OpenRC: start, stop, restart, enable, disable. |
| Docker | Containers with live CPU, memory, network and block I/O; logs; start, stop, restart, remove; images; Create Container… and Install Stack…. |
| Apple Containers | Apple's container CLI on a Mac host: what is running, start and stop, logs. Hidden on Linux and Windows hosts, where the CLI does not exist. |
| Kubernetes | Read-only cluster health where the host has kubectl: nodes and pods with a dot each, and the context they came from. |
| Files | Browse, edit text files, drag-and-drop upload, download files or folders, new folder, delete. |
| Ports · Logs · Terminal | Listening ports and connections; the log viewer; an in-window terminal with several sessions. |
| Users · Packages · Cron · Firewall | The same remote-management tools as the server pane. On a Mac the Packages tab is named Homebrew, since that is what a Mac actually uses. |
| Power | Reboot (or reboot via the monitor when SSH is wedged), plug / PDU / KVM power, PDU commands, linked UPS, Wake-on-LAN. |
The window is meant to be driven from the keyboard. Arrow keys move the selection through the board or the list, with up and down stepping a whole row of tiles; ⌘↑ and ⌘↓ jump to the first or last target; ⇧⌘0 returns to the board; and esc steps back out — detail, then board, then closing the window. ⌘1 to ⌘9 switch straight to a layout, ⌥⌘← and ⌥⌘→ cycle through them, ⌘E edits the current one and ⌘⌫ hides the selected target from it. ⌘F focuses the filter, ⌘R samples now, ⌥⇥ moves between a server’s tabs, ⌘T opens a terminal window, ⇧⌘O opens the selection in the main window, ⇧⌘K runs one command on every server, and ⌃⌘S shows or hides the list. Press ⌘/ for the full map at any time.
Run on All… runs one command across every server in the layout. Devices have their own detail: gateways and IDS alerts for a router, battery and voltages for a UPS, per-port control for a PoE switch, hashrate and shares for a rig, console and power for a KVM, state and watts for a plug.
A connected Proxmox VE cluster adds one tile per node to the All Servers, Cluster and Everything layouts, with CPU, memory, disk and uptime sparklines and a count of running VMs and containers. Its detail lists every guest with start, shut-down, reboot, stop and reset controls, the node's storage and the cluster's quorum, and offers Boot an ISO… into the Boot Media pane. Connecting a cluster is covered in Chapter 8.
Three controls sit in the window's own titlebar. Appearance makes this window alone dark or light — useful for a monitoring board you want dark while the rest of the app stays light — cycling follow-the-app, dark, light. Tab layout moves a selected server's tabs between a strip above the content and a vertical list beside it, which suits a tall window and shows every tab at once. Keyboard opens the shortcut list. Both toggles are also in the layout editor, and on ⇧⌘D and ⇧⌘L.
FrontierStack User Manual · Version 1.0.0 · Chapter 11