Chapter 3
The Interface
One window, a thousand services. This chapter is the guided tour: the sidebar, the panes, the floating palettes, Search, Help and the small touches that keep the app out of your way.
FrontierStack manages an enormous range of services, yet it presents them through a single, familiar macOS window: a sidebar of things on the left, the screen for the selected thing in the centre, and a row of always-available tools in the toolbar. Learn this layout once and every pane in the book — from Apache to a Cloudflare zone — sits exactly where you expect it. This chapter walks the interface end to end so the rest of the manual can simply say "open the Sites pane" and trust that you know how.
3.1The main window
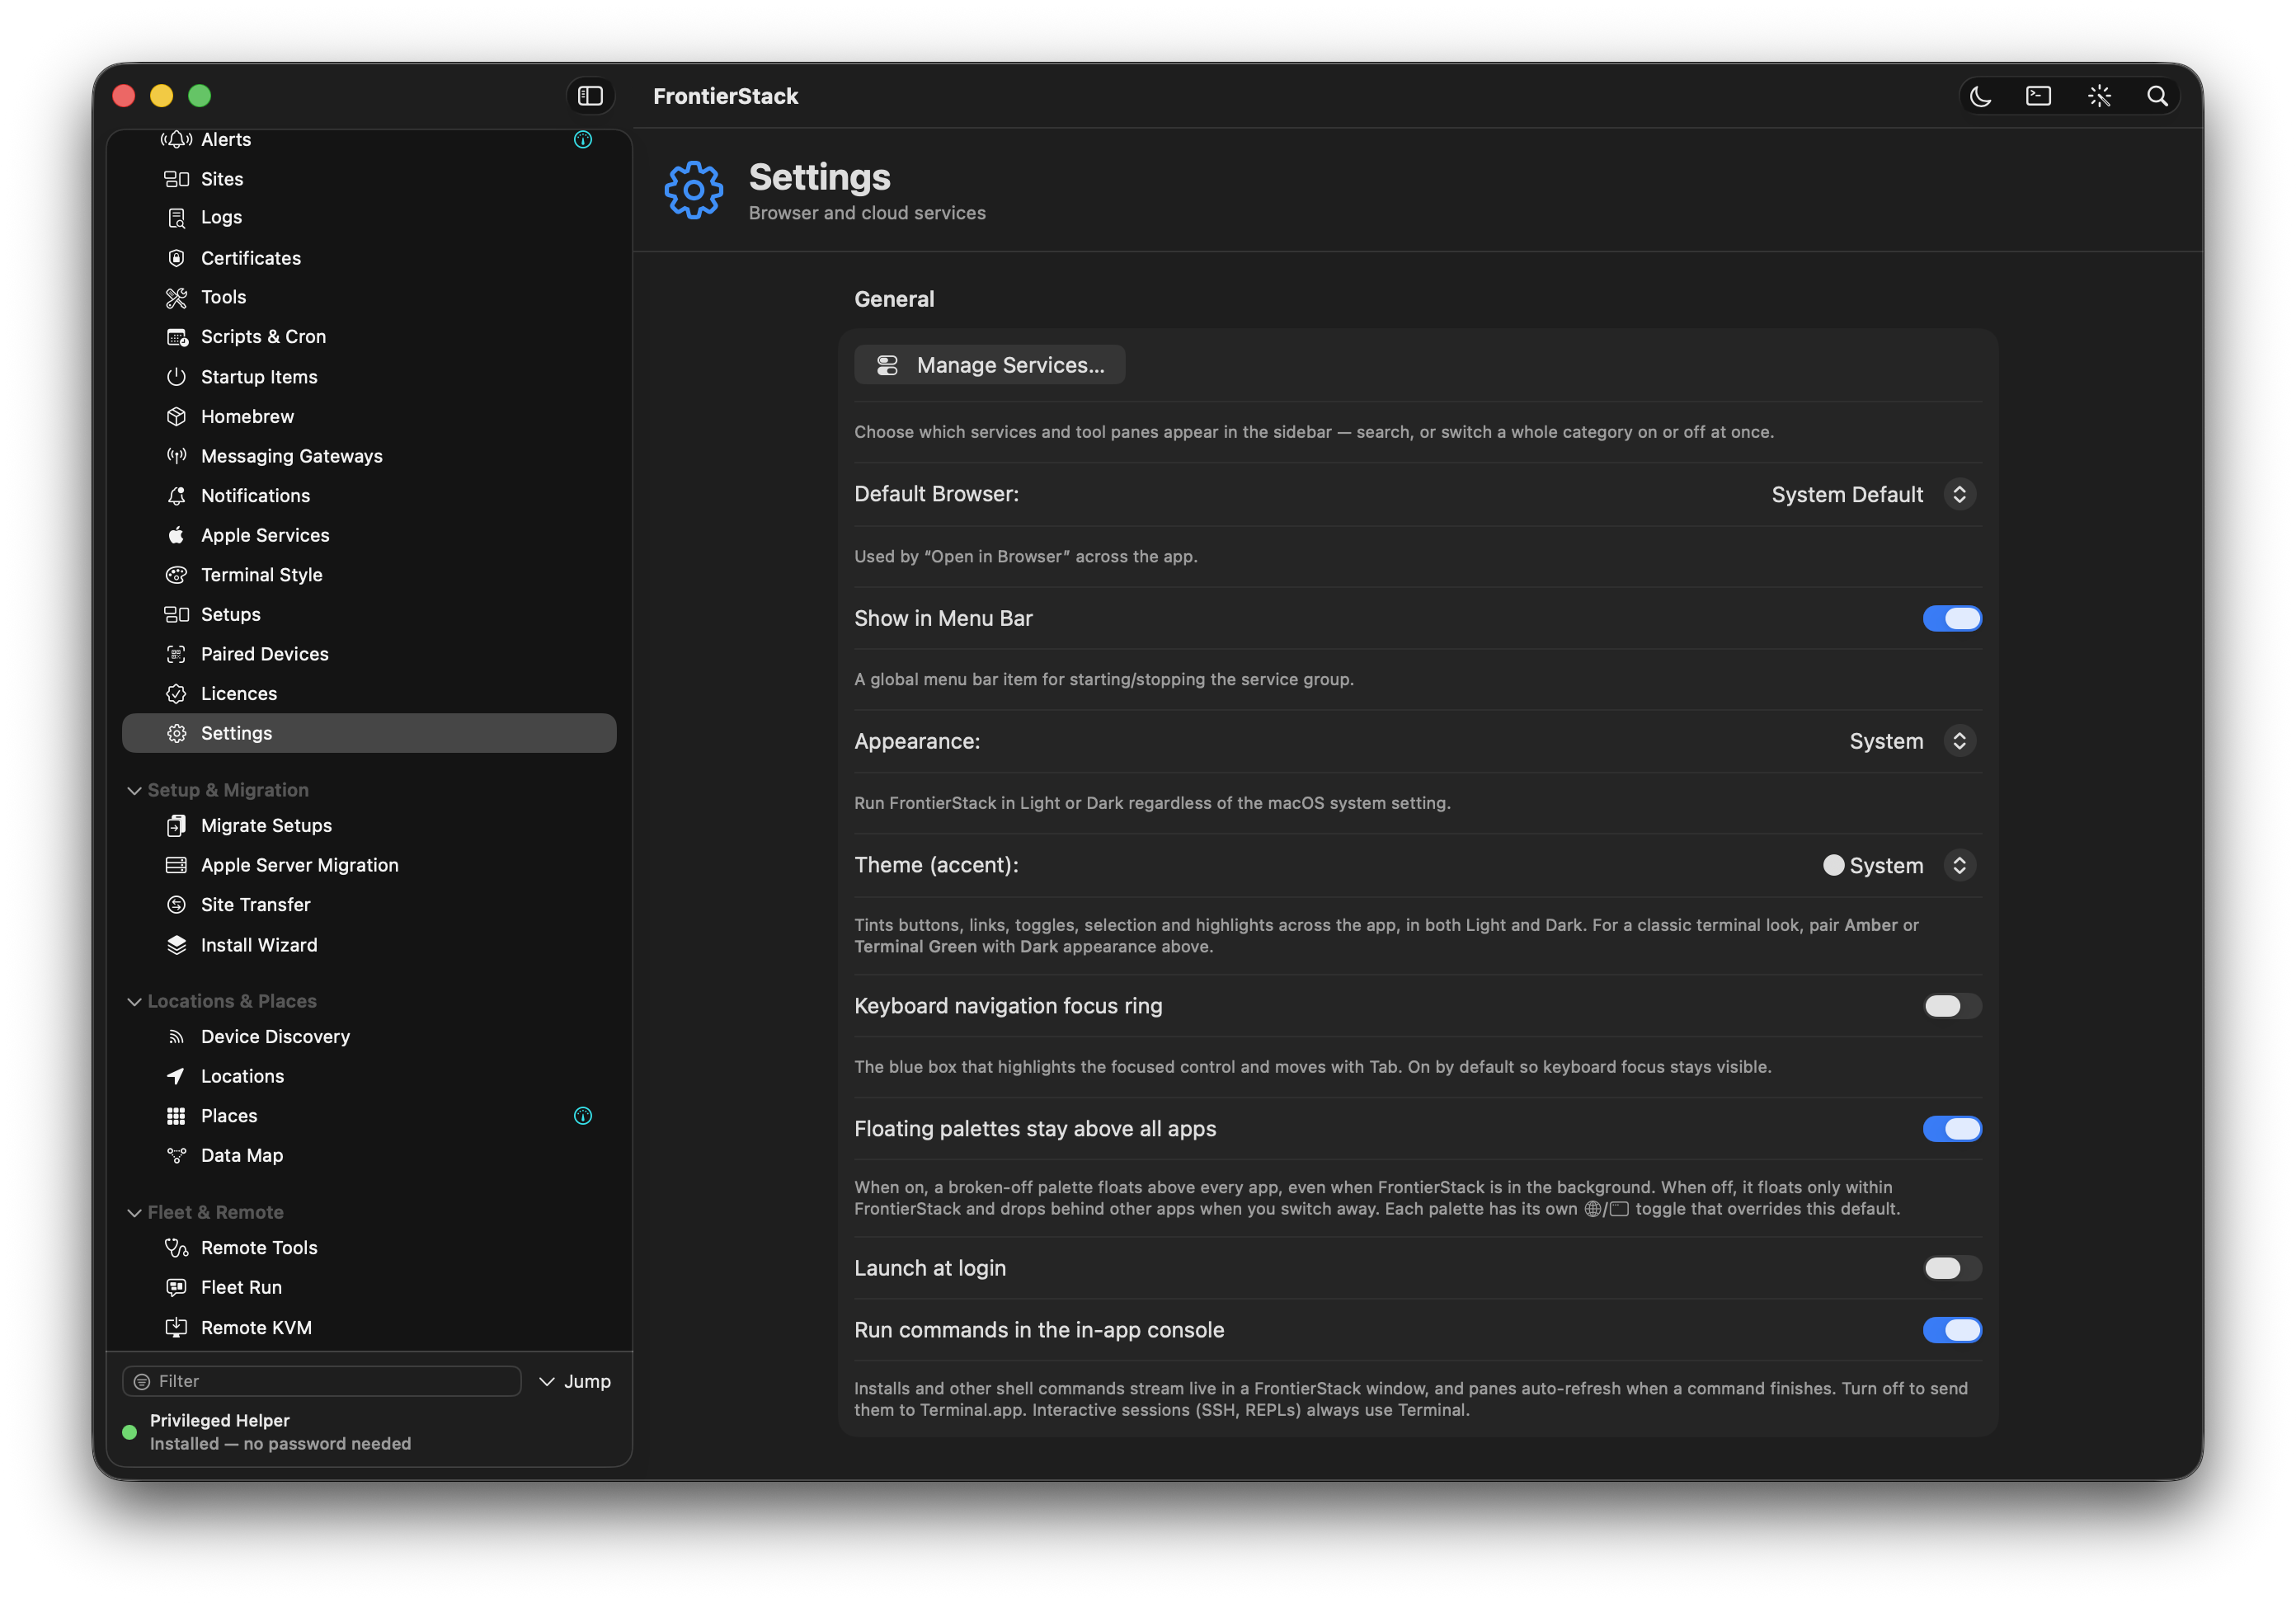
The window is a standard macOS NavigationSplitView with three regions. On the left is the service sidebar: a scrollable, collapsible list of every service and tool you have chosen to see, grouped into categories. In the centre is the active pane — the screen for whatever you selected in the sidebar, with its own header, tabs and controls. Running across the top is the toolbar, whose buttons are available no matter which pane you are in.
From right to left, the toolbar holds: Search (the magnifying glass, also ⌘F); the AI assistant (the wand, which opens the floating command palette); a Shell button that drops a terminal into the current working directory; a Dark mode toggle that forces dark even when macOS is in light; and, when the selected pane can be floated, a break-off button to pop it out as a palette. If you have unsaved changes to a Setup, an orange Unsaved menu appears here too.
The sidebar's width is yours to set — drag the divider and FrontierStack remembers it across launches. Your last-selected pane is restored when you reopen the app, so you return to where you left off.
Sidebar groups tame a sidebar that spans several sites or companies. Right-click any pinned server, device, Cloudflare zone, Wi-Fi network or cluster and assign it to a group ("Osaka office", "Acme Corp"); group rows at the top of the sidebar then switch between the sets, showing the active group's items plus everything ungrouped — grouping is optional, and ungrouped items are always visible. A red count on a non-active group warns that something hidden inside it has a problem, and a group linked to a Location activates itself when you arrive on that network. The iPhone app mirrors the same folders in its Fleet tab.
3.2The service sidebar
The sidebar is organised into two tiers. At the top sits Overview — the app's own built-in tools: Local Health, Status Page, Alerts, Domains, Logs, Certificates, Notes, Scripts, Setups, Settings and more. Below it, one section per service category — Web Servers, Databases, Caching, Mail, Networking, Security Tools, Containers, AI and dozens more — each listing the services you have chosen to show from the catalog (Chapter 6). Every section header is a chevron you can click to collapse, and the app remembers which groups you leave folded.
Each service row shows a status dot when it is running. Right-click a service for two quick actions: Pin to Top of Section keeps a service you touch often at the top of its category, and Hide removes it from the sidebar. Hiding never uninstalls anything — the service keeps running and stays reachable from Search; it just stops cluttering the list.
Below the categories, the sidebar grows extra sections for the things you pin elsewhere in the app: linked servers (each with little category icons showing which services it runs), monitored Wi-Fi networks, Cloudflare zones and Kubernetes clusters. Type in the filter field at the top of the sidebar to narrow every section at once.
3.3Presets and Setups
Two features shape what the sidebar shows. The Presets menu (in the menu bar) is the fast way to load a whole use-case at once. Its Base — show services for… section swaps the sidebar to a curated set for a scenario (a web stack, a mail server, a shop), while Add to current view… layers an extra group onto what you already have. Show All reveals everything; it is the escape hatch when you cannot find something.
Setups go further: a Setup is a named snapshot of your whole working view — which services are hidden, which are pinned, and the floating palettes you have open and where they sit. Save one from Presets ▸ Save Current as Setup… (or from the Setups pane), then flip between Setups from the top of the Presets menu; the active one carries a check mark. The palette layout auto-saves into the active Setup as you move windows around, so a Setup always reflects how you really work. Change which services are shown and the Setup goes dirty; the toolbar shows an orange Unsaved badge with Update, Save as New and Revert.
A Setup can also be bound to a Location (Chapter 8). Bind your "Office" Setup to your office network and FrontierStack switches to it automatically when you arrive — the right services, the right palettes, for where you are.
3.4Floating palettes and mini-palettes
Sometimes you want to keep one screen visible while you work elsewhere. Any monitor-style pane can be broken off into a floating palette: a small, always-on-top utility window built on macOS NSPanel, so it stays above the main window and other apps. Use the break-off button in the toolbar (or ⌘⌥⇧W to close the front palette). Local Health, Containers, Cloud Servers, the Wi-Fi Analyzer and others all float.
For an even lighter footprint there are mini-palettes — compact, glanceable summaries rather than the full pane. Minis exist for Local Health, Cloudflare Zones, Wi-Fi, Printers, Router & Network, Containers, Scripts, Message Delivery and AWS. Each mini row has a button to open the matching pane in the main window when you need the detail. Open palettes are part of a Setup, so a saved view restores your floating windows exactly as you arranged them.
3.5The command and AI palette
The wand button in the toolbar opens the AI assistant palette — a draggable, always-on-top NSPanel with a single ask-anything field ("why is my site down?", "tune MySQL", "show only what I use"). It is the same AI Administrator covered in Chapter 13, surfaced as a floating window you can keep beside whatever you are doing. Like every floating palette it stays above the main window; unlike the others it talks back, proposes fixes and — with your approval — acts. It carries its own conversation history and an approval card for any mutating action, so nothing runs until you say so.
3.6The menu-bar item
FrontierStack can place a small item in the macOS menu bar (toggle Show in Menu Bar). It is the quickest way to act without bringing the whole window forward. From it you can Start or Stop your startup group, Restart any of the core servers (Apache, Nginx, PHP-FPM, MySQL, Postgres) or everything running at once, refresh status, set Launch at Login, and open or quit the app.
The Localhost section lists what this Mac is actually serving right now: each entry is a web UI found by probing the ports that really have a listener (dev servers such as Vite on any port, admin consoles, Apache or Nginx on 80/443), and one click opens it in your browser. A port published by a running Docker container shows the container’s name, and a Containers running row jumps straight to the Docker pane. The list refreshes each time the menu opens; Refresh Status forces a new scan immediately.
3.7In-app Search
Search (the magnifying glass, ⌘F) is the fastest way to reach anything. Start typing "search services, tools & actions…" and the palette matches panes, tools, services and actions as you go — including services you have hidden from the sidebar. Pick a result and the app navigates straight to it. A Semantic mode lets you search by meaning ("block an IP", "free up disk") rather than exact names, so you can find a capability without knowing what FrontierStack calls it.
3.8The Help window
Open Help with ⌘? for a dedicated FrontierStack Help window. It is a real book of in-app documentation, organised to mirror the app. Help is more than reading: its pages carry Open in app links. Click one and FrontierStack jumps the main window to that exact pane or service — the Help window stays open beside it, so you can read a procedure and follow along step by step. Many panes have a small help button in their header that opens Help at the matching topic.
3.9The Notes pane
Notes is your private place for credentials, runbooks and per-service instructions. Each note has a title, a service tag and a body, and the whole thing is encrypted in the macOS Keychain — not stored in plain files. The defining feature is the per-note lock: every note carries a Share with AI Administrator toggle that is off by default. While a note is locked, the AI literally cannot read it. Unlock a note only when you want the assistant to use those credentials or steps; it then appears in the AI's list_notes and can be read on demand.
3.10The Status Page
The Status Page pane publishes a static index.html built from the same up/down data as Local Health, so customers or colleagues can see what is running without access to the app. Choose a destination — a folder inside one of your Apache sites' DocumentRoots, so it is served at a path like /status/ — set a page title, and decide whether to Include item details (leave detail lines off for a public page, since they can reveal internal hosts and ports). The page regenerates on an interval you set, or on demand with Generate Now. Serve with picks Apache or the built-in server (a bundled static file server on a port of your choice, localhost or LAN), and Launch keeps that server running at login or at system start so the page outlives the app. A Servers section can list pinned servers with monitors, kept live even while the app is closed, and Internet access offers persistent routes (Cloudflare Tunnel, Tailscale, router port-forward with Dynamic DNS). Chapter 11 has the details.
3.11Local Health and Locations at a glance
Two Overview panes anchor everyday use, and each has a full chapter of its own. Local Health is the board that answers "is everything OK?": every monitored service, device and subsystem with an UP or DOWN state and a one-line summary. You mark items as critical from their own panes to add them to the board, and it doubles as a floating palette and a mini. Its full treatment — the health sweep, thresholds and how it drives alerts — is Chapter 11.
Locations teach the app where your Mac is on the network right now — Home, Office, On VPN — matched from the Wi-Fi network or subnet. Locations make monitoring network-aware: while you are somewhere unrecognised the app treats you as Away and pauses location-scoped checks, so a café or hotel network never sets off false alarms. They also bind Setups, as we saw above. The complete model — defining locations, scoping alerts and reachability, the fleet — is Chapter 8.
With the layout learned, you are ready to put it to work. The next part of the manual opens the panes themselves, starting with Chapter 4, The Web Stack.
FrontierStack User Manual · Version 1.0.0 · Chapter 3